There are no Indigenous words for these birds in the Pacific Northwest (PNW).
Sailors called them “boobies,” meaning stupid, because they were unafraid of people. They are large, colorful, tropical seabirds, historically only found at the southern edges of the continental United States – Florida, the Gulf Coast, and (rarely) southern California, to quote from my old 1966 Golden Field Guide, the beige one with the three buntings on the cover. That book only mentions three boobies: Blue-faced (since renamed Masked and now with Nazca split off from it), Brown (now with Cocos split off from it), and Blue-footed. Red-footed was so rare it wasn’t mentioned.

Here is the range of the Red-footed Booby, as posted on their Birds of the World species account:
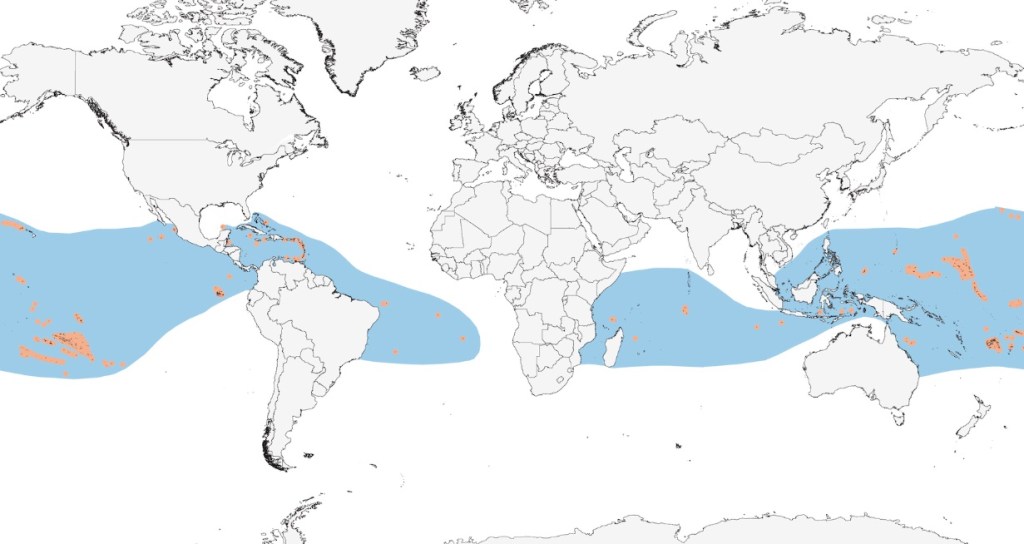
Now, four boobies – Red-footed, Nazca, Cocos, and Blue-footed – are annual in California (where all have been removed from the “review list”) and regular in the Pacific Northwest (PNW, defined here as Alaska, British Columbia, Washington, and Oregon). Prior to the 1980s, the PNW had only a single booby record – a Blue-footed found dead in 1935. Since then, boobies of one species or another have been documented 146 times. 86% of those have been in the last 11 years.
Even adjusting for increased reporting in recent decades, the increase in booby sightings has been among the most hair-raising and mind-boggling developments in the bird world.
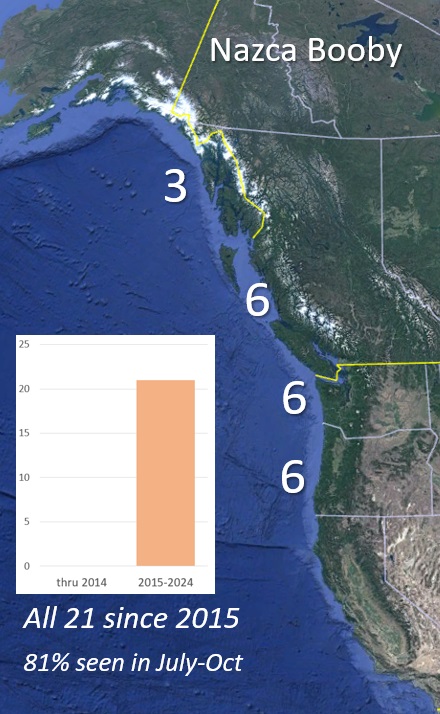
Red-footed Booby
The PNW’s first Red-footed Booby was in 2015 in Alaska. Since 2018, they’ve become nearly annual. There are now 13 records:
AK: 6 – Aug 2015; Sept 2015; Sept 2019; June 2021; Sept 2022; Aug 2023
BC: 1 – Sept 2018
WA: 4 – Sept 2018; Sept 2023; Oct 2023; July 2024
OR: 2 – May 2019; Nov 2019

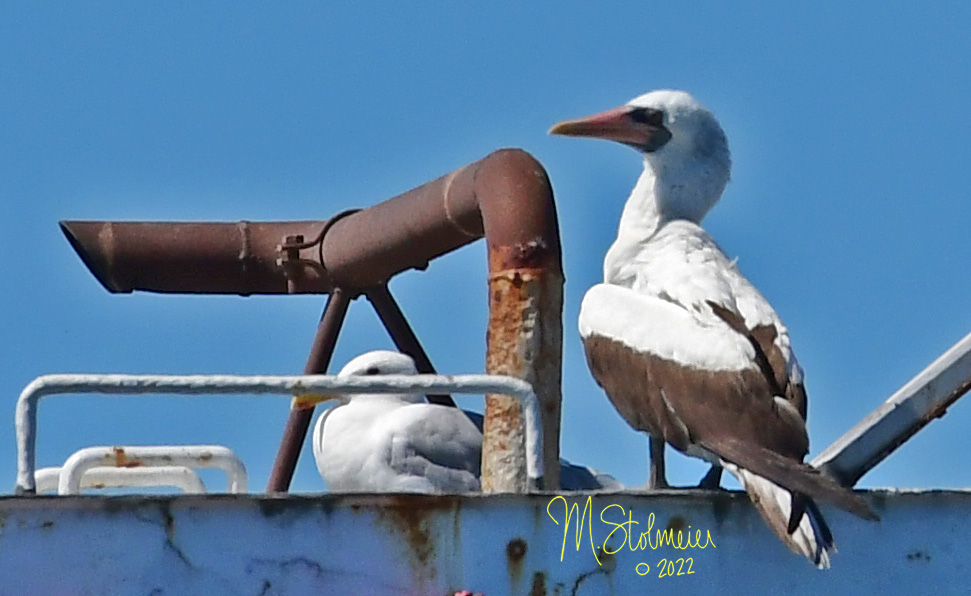
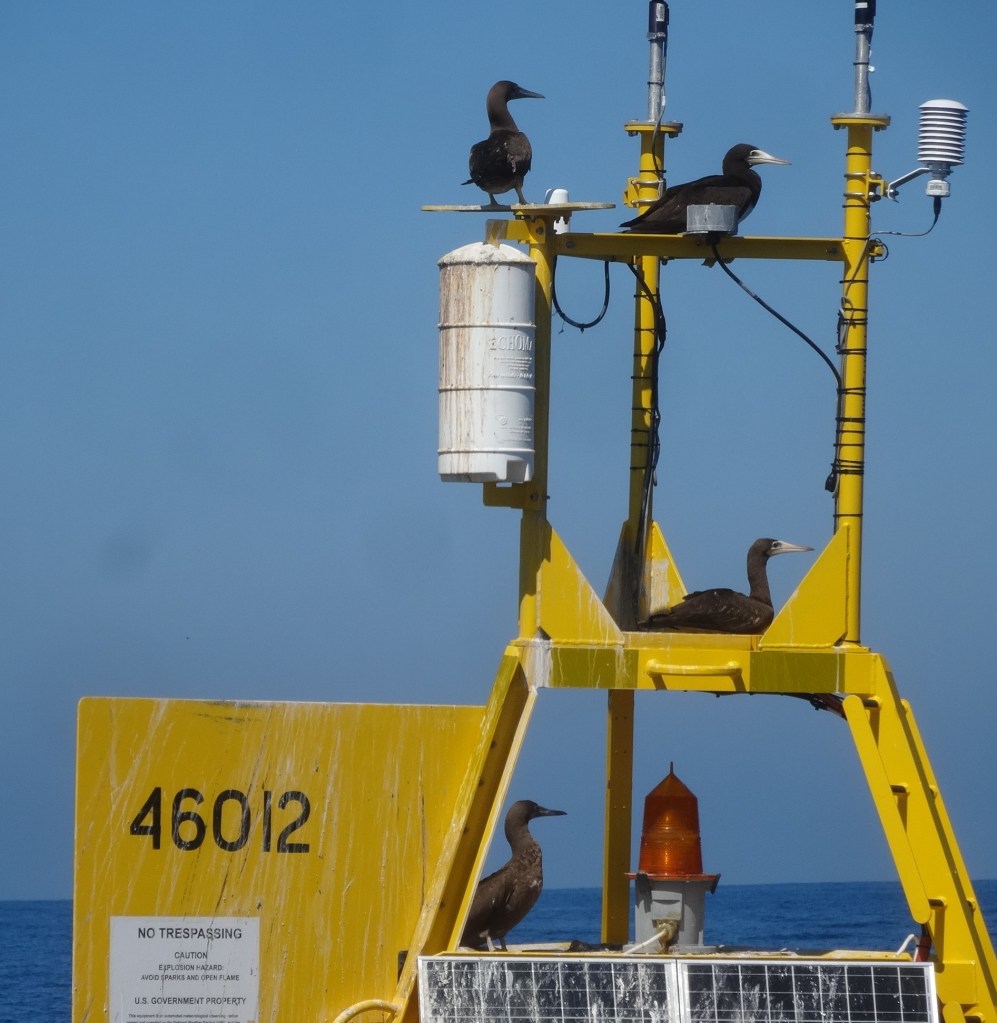
The Red-footed Boobies in the PNW most likely emanate from breeding colonies off southern Mexico or the Galapagos. Most were found on vessels far offshore or dead on beaches. The Port Townsend bird represents the most reliable and confiding individual that can be enjoyed by thousands of people.
Most have occurred in August and September, paralleling similar seasonal movements of Brown Pelicans and Heermann’s Gulls, both species which nest primarily in Mexico, migrate up the coast to the PNW in summer, and return in fall. It’s no surprise that Port Townsend’s Red-footed Booby often roosts with several hundred Heermann’s Gulls, its potential traveling companions.
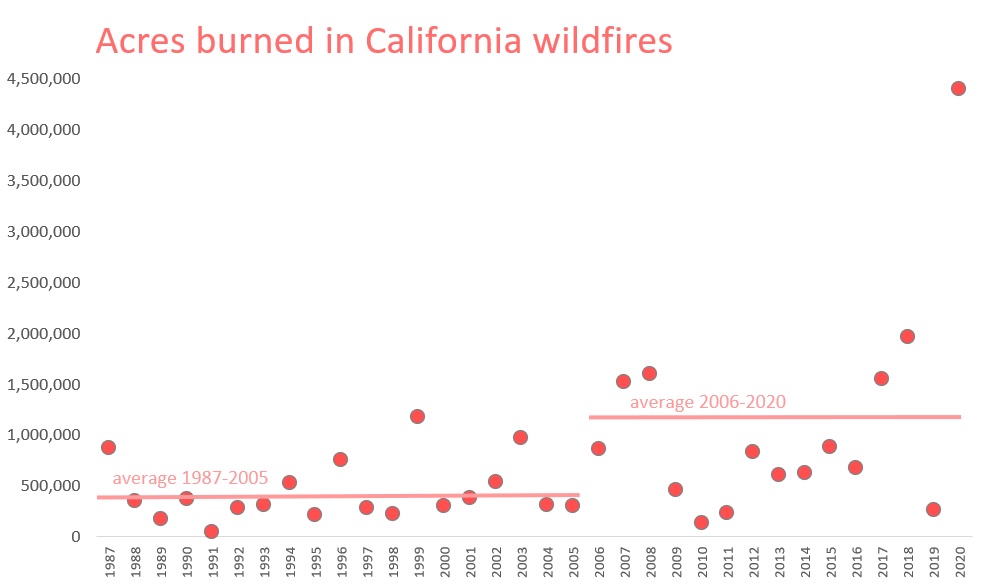
The pattern in California, with a larger sample size, is illustrative of the pattern of increase of boobies into PNW waters. For Red-footed, California’s first record was in 1975. This grew to 19 records by 2012. Since then, they’ve had about 200, including an invasion of 37 birds (though some may involve the same bird moving around) in 2018, the same year the PNW had two. The following year, with 105 records, the California Bird Records Committee removed it from their review list. They now occur regularly, with sometimes dozens of reports each year. These are largely limited to southern California. North of Cape Mendocino, California still has only two records (2021 and 2023).

Nazca Booby
Split off from the Masked Booby in 2000, many records – and disproportionately older records from before the split and the advent of 400mm lenses – are now treated as Masked/Nazca, as identification cannot be confirmed. Here, I focus only Nazca Booby records, though surely some were around earlier.
Largely from the Galapagos, the first Nazca Booby in the continental US didn’t occur until one was found dead on Ventura Beach, California in 2013. (This was during the Refugio oil spill. I was involved in the bird injury assessment for the California Department of Fish and Wildlife at the time, and played a small role in this record by ensuring that the carcass was properly examined and identified by Kimball Garrett. The carcass was in poor condition and may have pre-dated the spill.)
Its pattern of occurrence in the PNW is remarkably like that of the Red-footed Booby – the first record was in 2015; it is now nearly annual; and it occurs primarily in late summer and early fall.
AK: 3 – Aug 2017; Sept 2023; Aug 2024
BC: 6 – July 2019; Sept 2020; Feb 2022; July 2022; July 2023; Oct 2023
WA: 6 – Aug 2020, Aug 2022, Sept 2022, Sept 2023, Oct 2023, Feb 2024
OR: 6 – Sept 2015; Sept 2018; Sept 2019; Dec 2021; Feb 2023; Sept 2023
Again, their pattern in California mimics that of Red-footed, with a dramatic increase in records beginning in 2013, a big surge in 2018 (30 records), removal from the review list in 2019, and 20 to 45 birds per year since then, totaling over 150 reports.

Cocos Booby
The Cocos Booby was formerly known as the brewsteri subspecies of Brown Booby. While the Brown Booby occurs worldwide, the form in the eastern Pacific was split off as the Cocos Booby this summer. The name comes from the tectonic plate, as does the impetus for the name of Nazca Booby.

Though the most expected booby on the West Coast, they have still exhibited a dramatic increase in recent years. Before 2006, there were only 96 records in California and 8 in the PNW.

Now they are resident breeders in California (on the Channel Islands, since 2017), and annual in the PNW. They were removed from California’s review list in 2007, from Washington’s in 2018, and from Oregon’s in 2023.
They don’t come from as far away as the Galapagos, and can show up year-round. In both California and the PNW, they’ve occurred in every month of the year, though most are in late summer and fall.
Records of the related Brown Booby in the East have spread remarkably inland, in Limpkin-esque fashion, across the Midwest to the St. Lawrence River. There are now Brown or Cocos Booby records for over 40 US states. These maps compare Brown/Cocos Booby records from 1970-2005 and from 2006-2024.
From 1970-2005, Cocos and Brown Boobies were strictly coastal, except in the Southwest, where birds from the Gulf of California may show up in nearby deserts after storms.


You’ll notice just the purple rectangles in the bottom graph, 2006-2024. Even when I shortened the period to just 2020-2024, eBird told me I had exceeded the 2000 point maximum to show the individual points.
Blue-footed Booby
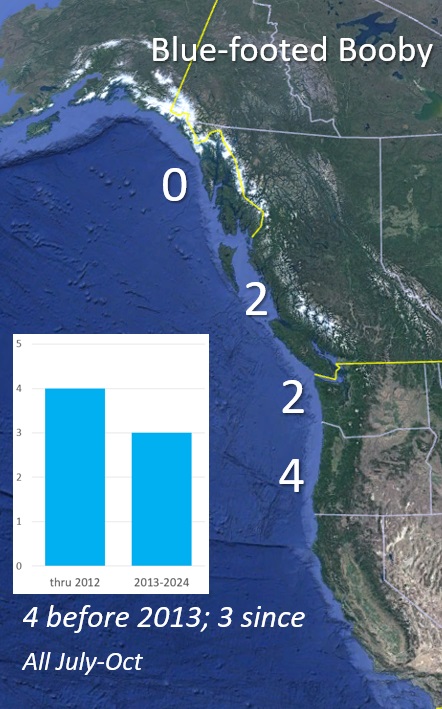
The Blue-footed is our most local booby, with large nesting colonies in the Gulf of California. They do not range widely at sea, and thus are not as prone to the wanderings of the species above.
Their northward incursions are like those of Brown Pelicans, with whom they nest in the Gulf of California. In years with high nest success followed by a collapse of prey fish, hungry juveniles spread north up into the Salton Sea, the Colorado River, and up the West Coast. Thru 2012, California had 114 records. In 2013, they had over 200. That incursion year also brought records to BC and OR.
AK: none
BC: 2 – July 1995; Sept 2013
WA: 2 – Sept 1935; Aug 2006
OR: 4 – Sept 2002; 2 in Oct 2013; Sept 2018
But incursions like the one in 2013 are more than one-off episodes. Like the Cocos Booby, they are expanding north as breeders. They started nesting on the Channel Islands in 2021 (2020 if you count a hybrid pairing with a Cocos Booby).

Why is all this happening?
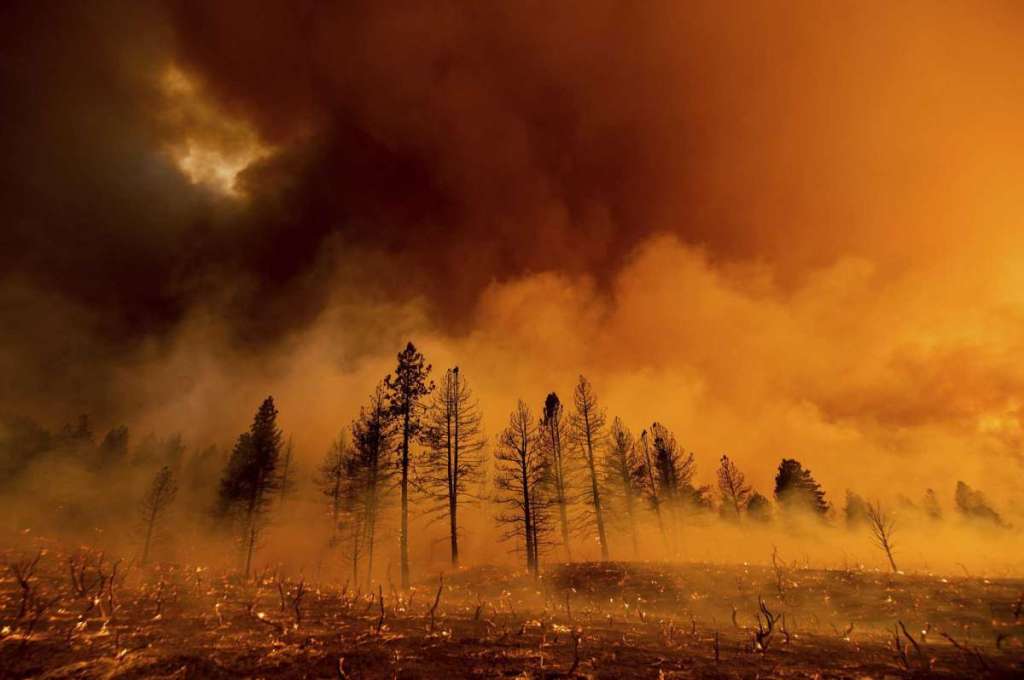
The obvious answer is climate change. After all, these are wide-ranging seabirds who can travel great distances in search of food, and sea surface temperatures are rising dramatically.
The infamous Blob began in late 2013, creating unprecedented sea surface temperatures (SST) in the North Pacific. By 2015 and 2016, it reached the West Coast, resulting in the collapse of fisheries (everything from Alaska Cod to Dungeness Crab) from Alaska to Mexico and beyond. Humpback whales breeding in Hawaii declined 34%.

Temperatures remain high. Bluefin tuna are reported from the Salish Sea, and mola molas are increasing in Alaska. Meanwhile, warmer waters negatively impact the food chain in the waters around the Galapagos. Boobies might not just be pulled to the PNW by warmer waters, but may also be pushed out of the tropics because fish become too hard to find.

The changes probably started before the first boobies showed up in the PNW. Reid et al (2016), writing in Global Change Biology, documented ecosystem-wide regime shifts in the mid-1980s, resulting in “a major change in the Earth’s biophysical systems from the upper atmosphere to the depths of the ocean and from the Arctic to the Antarctic.”
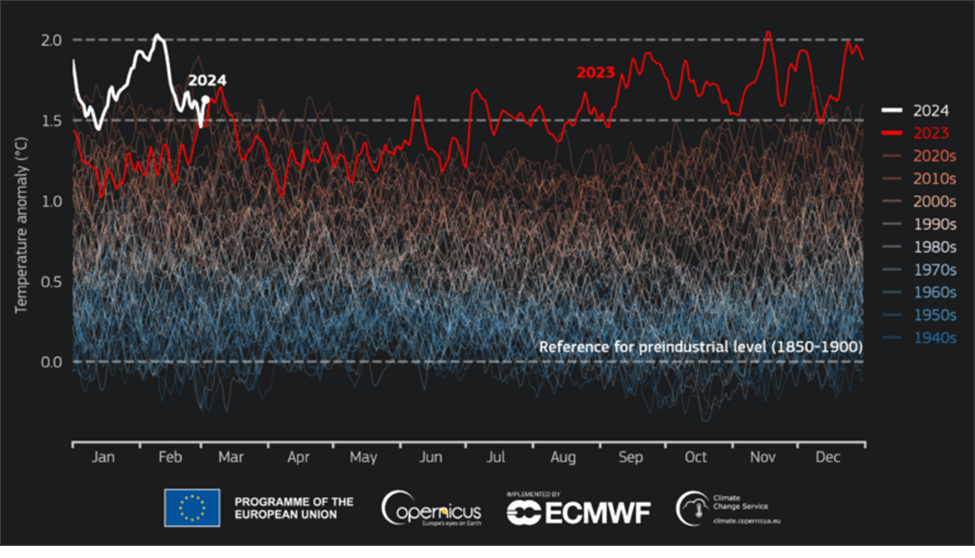
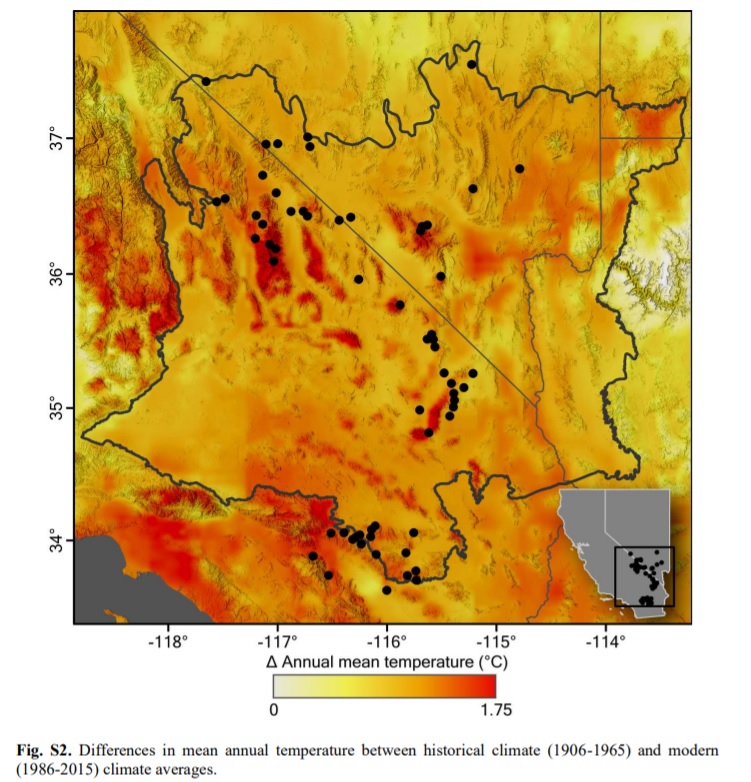
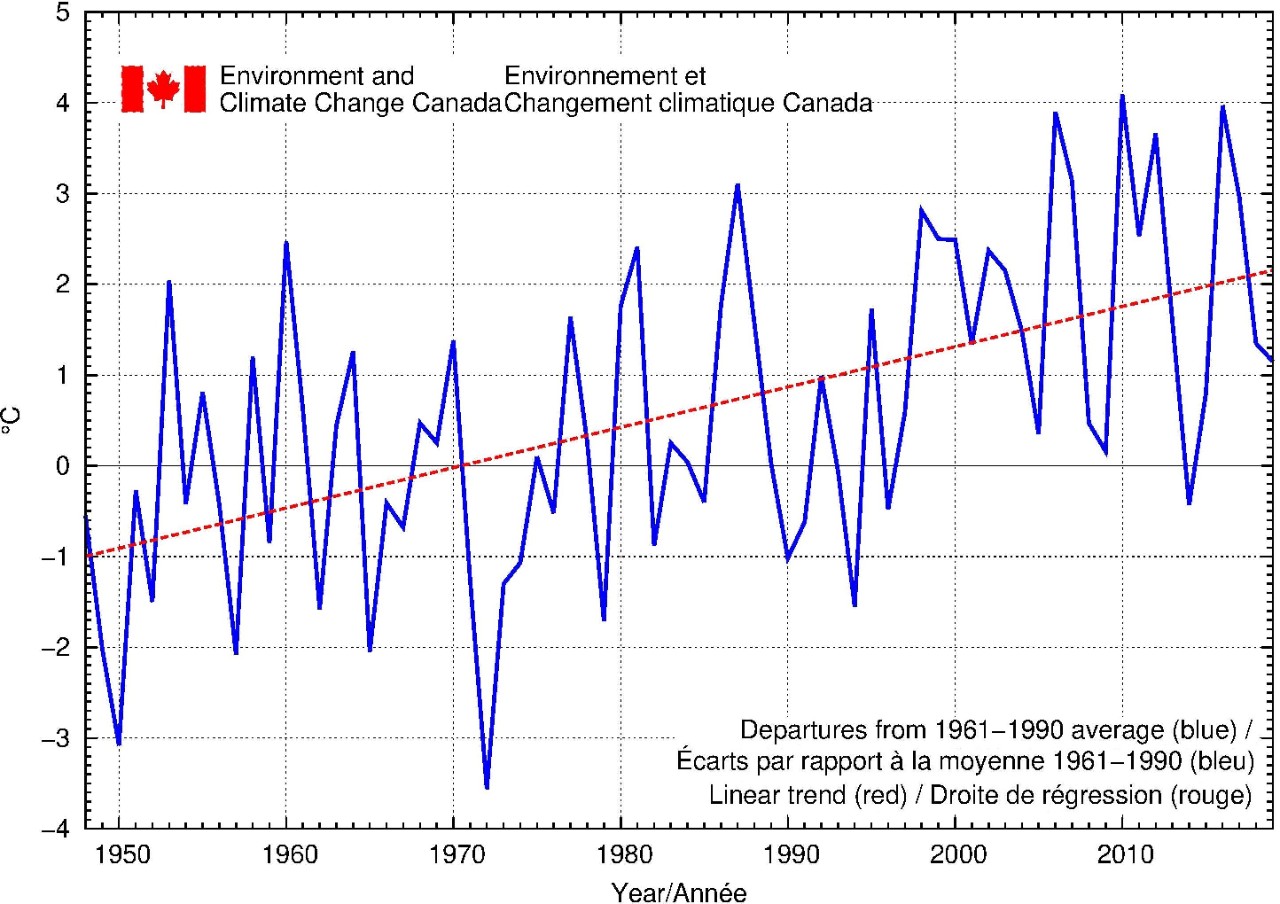
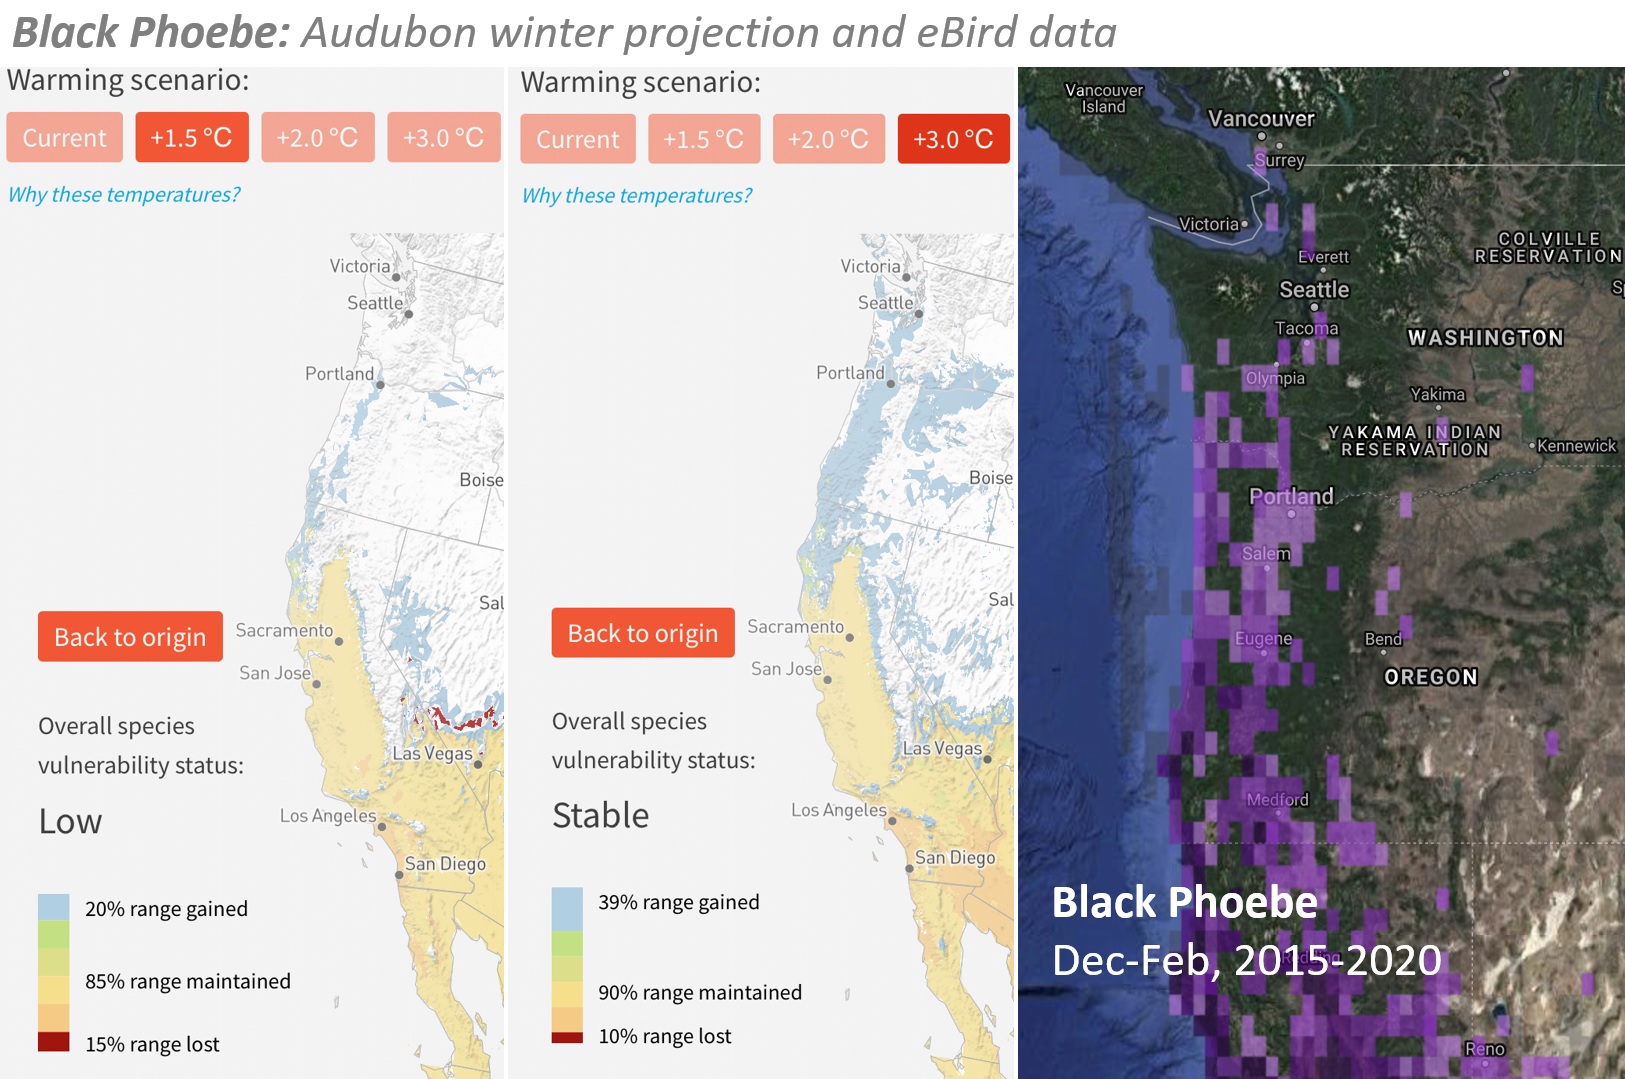
With climate velocity – the speed of climate change – increasing since then, one can imagine a series of regime shifts occurring practically every year. The concern among scientists is that, because the current rate of change is at least 10x faster than the fastest documented changes from prehistoric times (such as during the Paleocene-Eocene Thermal Maximum, or the PETM), many plants and animals cannot adapt fast enough. The PETM, while a spike in the prehistoric record, saw temperatures increase 5C over 5,000 years; that’s 1C per 1000 years. The graph above shows an increase of 1.5C in 123 years; that’s 1C every 82 years. Animals never noticed the PETM warming, and they literally evolved through it. Today, an individual booby may experience a changing climate within their lifetime.
In oceans, food webs begin with nutrients and plankton and end with fish and fish-eaters such as boobies. Water temperature is everything. Each species adapts – or not – to climate change in different ways, crossing various thresholds at different times. Boobies fly long distances to find food. It remains to be seen whether they can adapt to changing ocean conditions, but it certainly appears they are trying.

UPDATE: For more on Port Townsend’s Red-footed Booby, including who found it when and where experts think it came from, see Port Townsend’s Red-footed Booby: A messenger from the future.


 In January 2020, Lawrence Livermore Laboratory released their detailed report
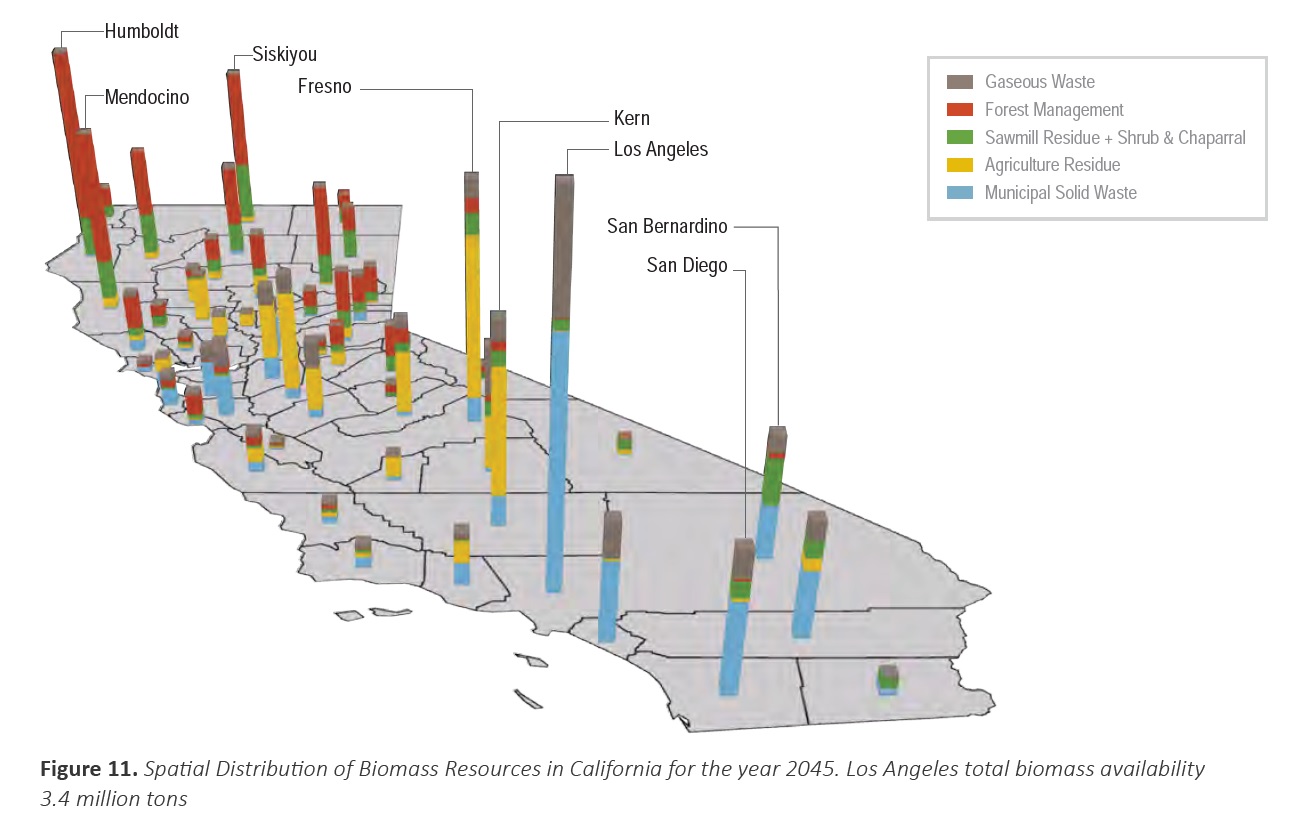
 Chapter 7 dives into the logistical details and infrastructure needed to connect the gathered biomass to the biomass fuel plants and the DAC plants to underground storage reservoirs. Among their main conclusions:
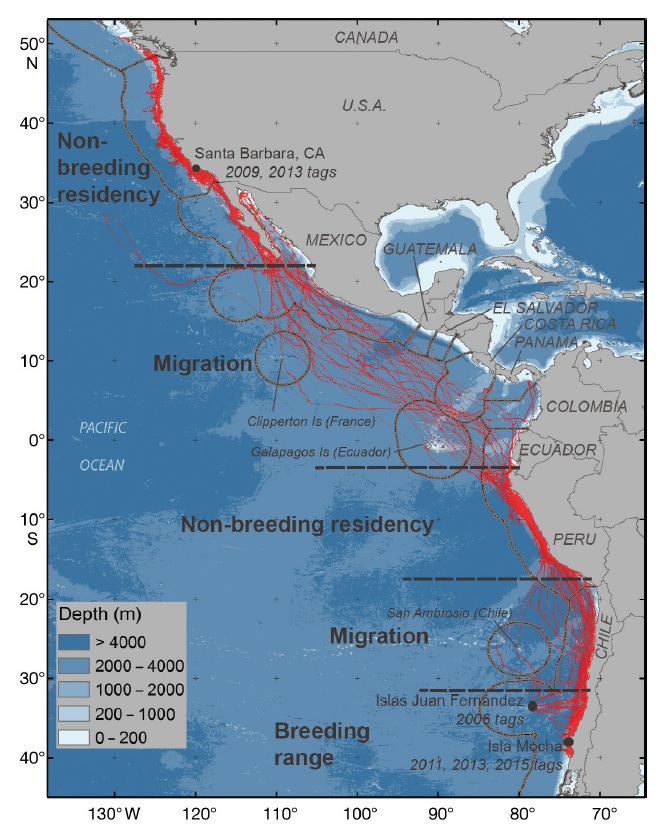
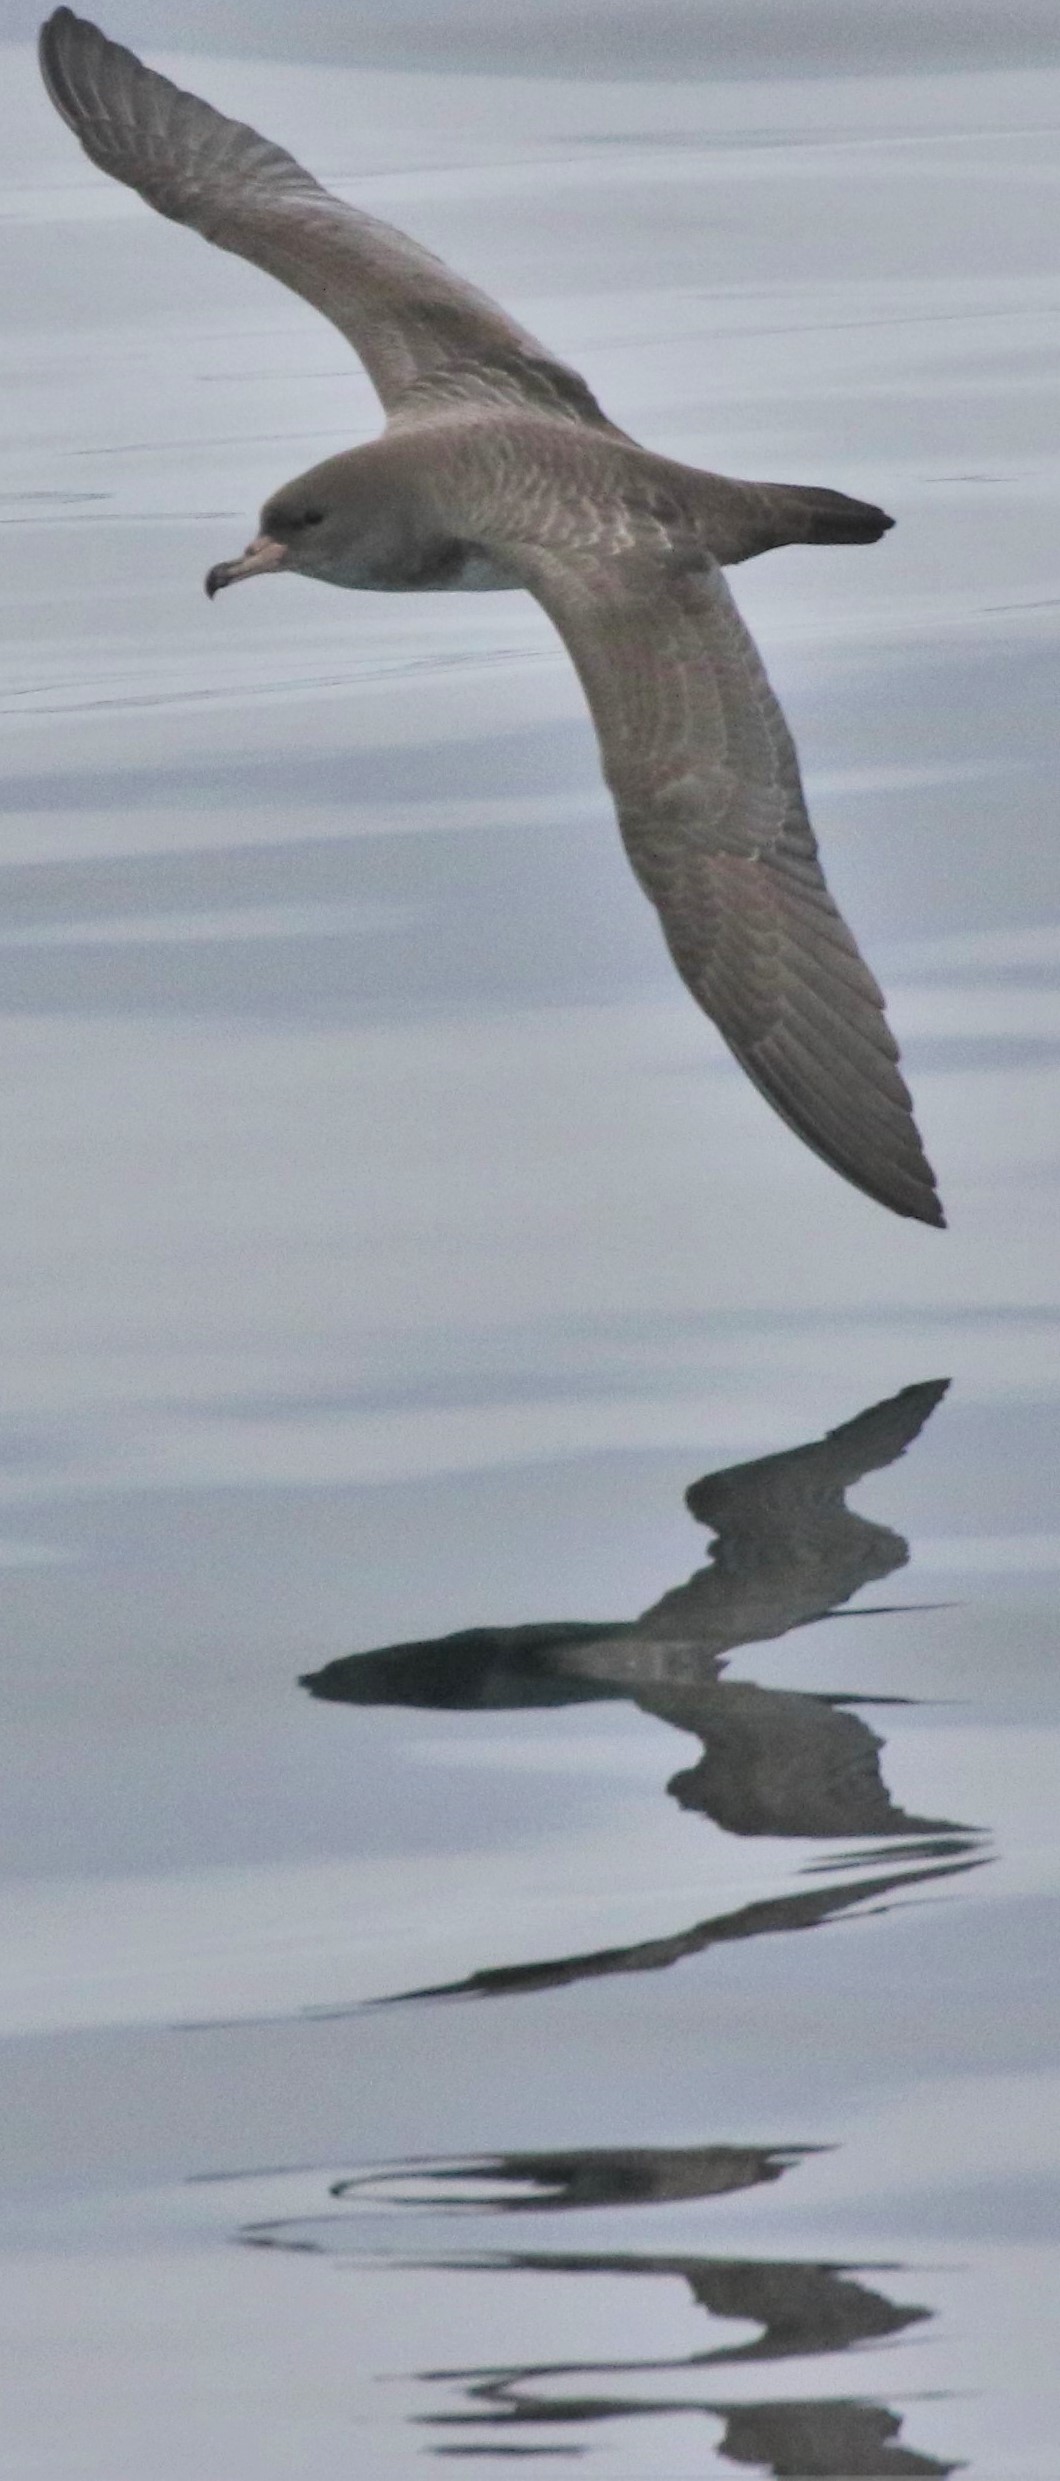 Many think of Pink-footed Shearwaters as a relatively common bird on West Coast pelagic trips. I like to call them the “photographer’s shearwater” because they invariably offer great photo ops off the back corner of the boat. But they are considered endangered by Chile, threatened by Canada, and vulnerable by the International Union for Conservation of Nature (IUCN). They could easily be called the Chilean or even Isla Mocha Shearwater, as the entire world’s population comes from just three islands off the coast of Chile, 85% from Isla Mocha, and the remaining 15% from Santa Clara and Robinson Crusoe Islands in the Juan Fernandez group.