Birds, because of their mobility, are considered to be fairly adaptable to climate change. They evolved in the aftermath of two of the world’s most catastrophic warming events (the K-T extinction and the Paleocene-Eocene Thermal Maximum), spreading to the Arctic, crossing continents, and evolving along the way. While those warming events took place over tens of thousands of years, the current warming is happening in the space of a couple hundred, with noticeable changes in climate within the lifespan of a single bird.
There will be winners and losers. Generalists, and species that enjoy warmer weather, are likely to be winners. Those with narrow food or habitat requirements, especially those dependent on the ocean or the Arctic/Antarctic, will likely be losers. Although counter-intuitive, it is primarily non-migratory resident species that seem to be more adaptable to a changing climate.
Recent studies
Studies of climate impacts on western North American birds using past data are limited, but some focusing on California were recently published. Iknayan and Beissinger (2018) showed that, over the last 50 years, “bird communities in the Mojave Desert have collapsed to a new, lower baseline” due to climate change, with significant declines in 39 species. Only Common Raven has increased. Furnas (2020) examined data from northern California’s mountains, showing that some species have shifted their breeding areas upslope in recent years. Hampton (myself) (2020) showed increases in many insectivores, both residents and migrants (from House Wrens to Western Tanagers), in winter in part of the Sacramento Valley over the last 45 years. These changes, particularly range shifting north and out of Southwest deserts, is predicted for a wide number of species.
The invasion of the Pacific Northwest
Here I use Christmas Bird Count (CBC) data to illustrate that some of California’s most common resident birds have expanded their ranges hundreds of miles north into Oregon, Washington, and British Columbia in recent years. The increases are dramatic, highly correlated with each other across a wide range of species, and coincide with rapid climate change. They illustrate the ability of some species to respond in real time.
In parts of Oregon and Washington, it is now not unusual to encounter Great Egret, Turkey Vulture, Red-shouldered Hawk, Anna’s Hummingbird, Black Phoebe, and California Scrub-Jay on a single morning—in winter. A few decades ago, this would have been unimaginable. Some short-distance migrants, such as Townsend’s Warbler, are also spending the winter in the Pacific Northwest in larger numbers.
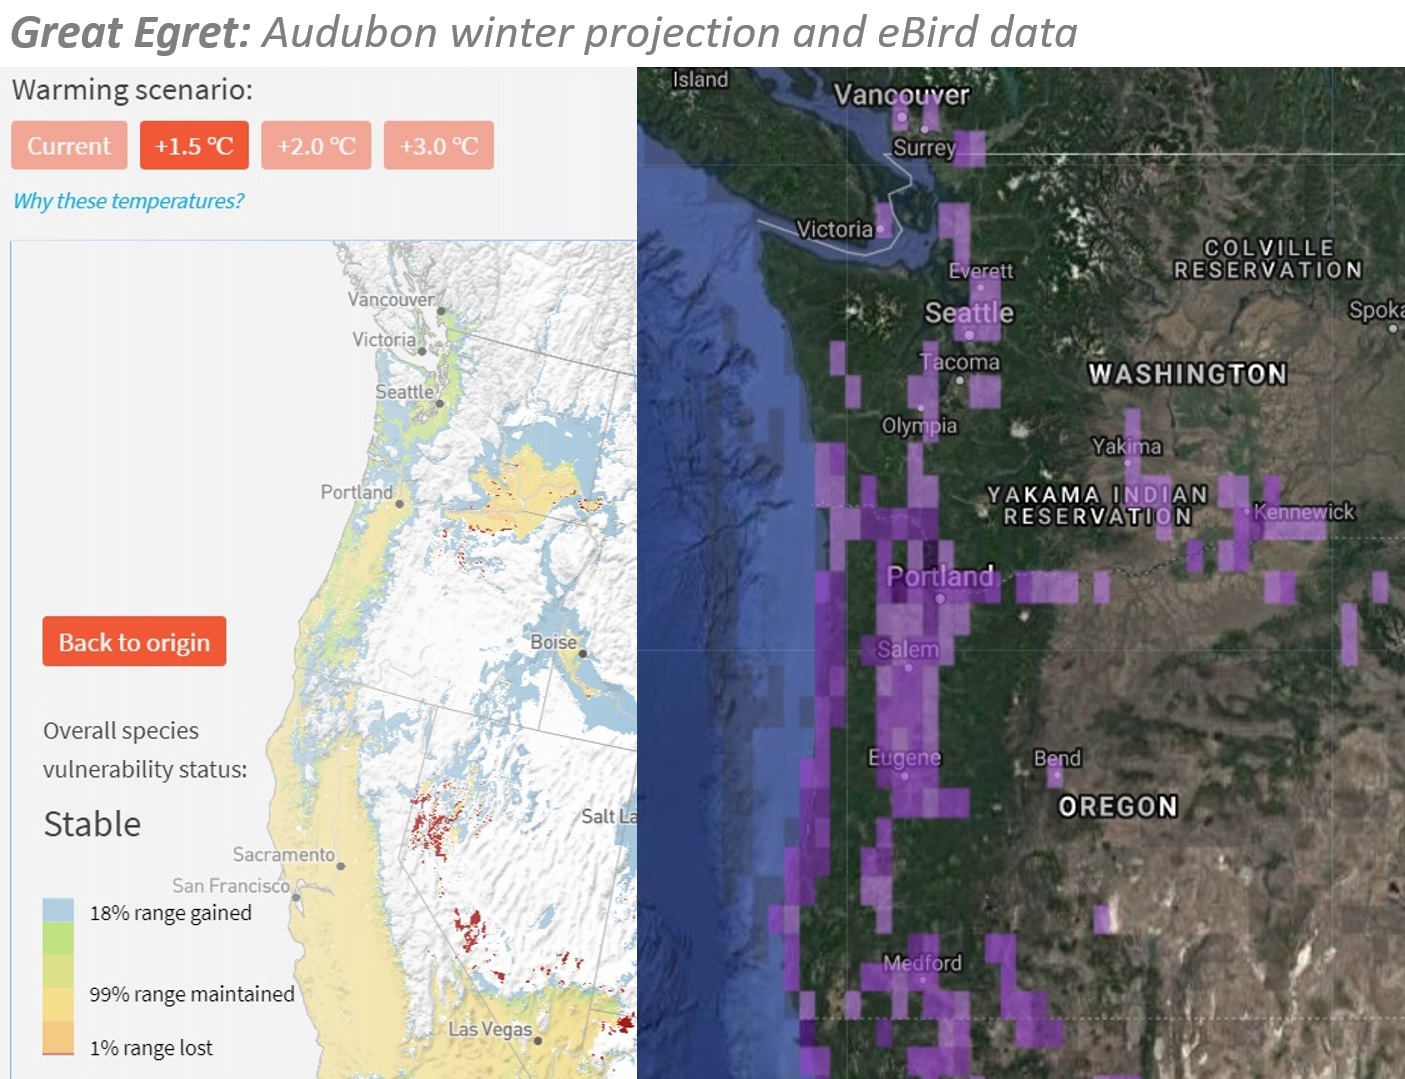
The following graphs, showing the total number of individuals of each species seen on all CBCs in Oregon, Washington, British Columbia, and (in one case) Alaska, illustrate the range expansions. Adjusting for party hours scarcely changes the graphs; thus, actual numbers of individuals are shown to better illustrate the degree of change. The graphs are accompanied by maps showing predicted range expansions by the National Audubon Society, and recent winter observations (Dec-Feb) from eBird for 2015-2020.
These range expansions were predicted, though in some cases the recent trends exceed even projected scenarios under 3.0C increases in temperature.
Let’s begin with the climate. Canada as a whole has experienced 3.0C in temperature increases in winter. British Columbia has experienced an average of 3.7C increase in Dec-Feb temperatures since 1948. The greatest increases have been in the far north; increases in southern British Columbia, Washington and Oregon have been closer to 1.5C.

Average nationwide winter temperatures deviation from average.
Great Egret
Great Egrets on Oregon CBCs have increased from near zero to nearly 900 on the 119th count (December 2018 – January 2019).
CLICK ON GRAPHS TO ENLARGE

But their expansion, which took off in the early 1990s into Oregon, is now continuing in Washington, with a significant rise beginning in the mid-2000s. Great Egrets occur regularly in southern British Columbia, but so far have eluded all CBCs.

They have not quite fulfilled the full range predicted for a 1.5C increase, but are quickly on their way there.
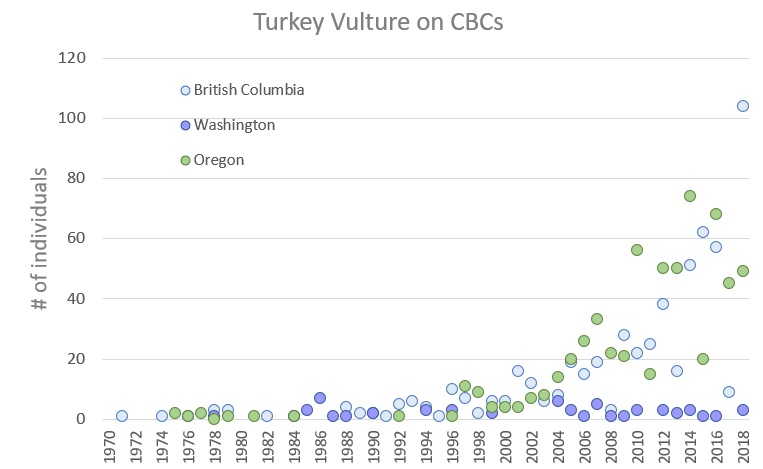
Turkey Vulture
Turkey Vultures began increasing dramatically in winter in the Sacramento Valley of California in the mid-1980s, correlated with warmer winters and a decrease in fog. Prior to that, they were absent. Now, over 300 are counted on some CBCs. That pattern has been repeated in the Pacific Northwest, though about 20 years later. Both Oregon and British Columbia can now expect 100 Turkey Vultures on their CBCs. Curiously, Puget Sound is apparently still too cloudy for them, who prefer clear skies for soaring, though small numbers are regular in winter on the Columbia Plateau.

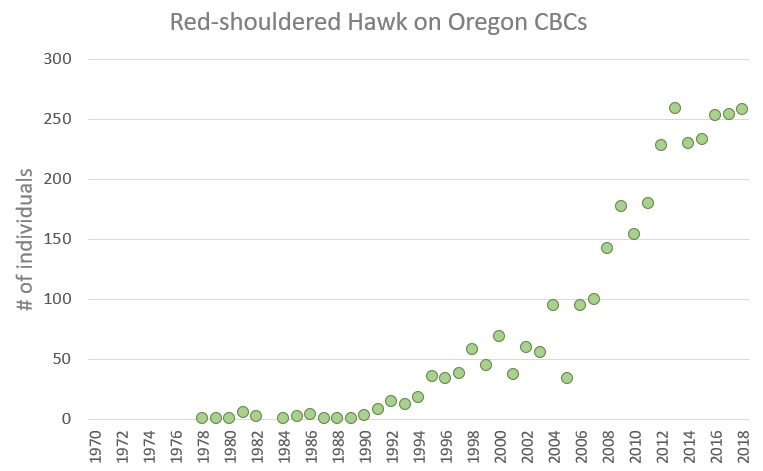
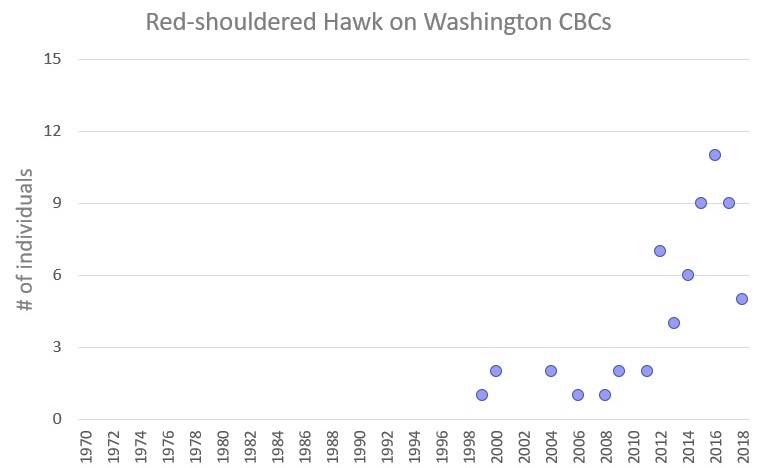
Red-shouldered Hawk
Red-shouldered Hawks have increased from zero to over 250 inviduals on Oregon CBCs, taking off in the mid-1990s.
 Twenty years later, they began their surge into Washington. It’s a matter of time before the first one is recorded on a British Columbia CBC.
While their expansion in western Washington is less than predicted, their expansion on the east slope, in both Oregon and Washington, is greater than predicted. This latter unanticipated expansion into the drier, colder regions of the Columbia Plateau is occurring with several species.

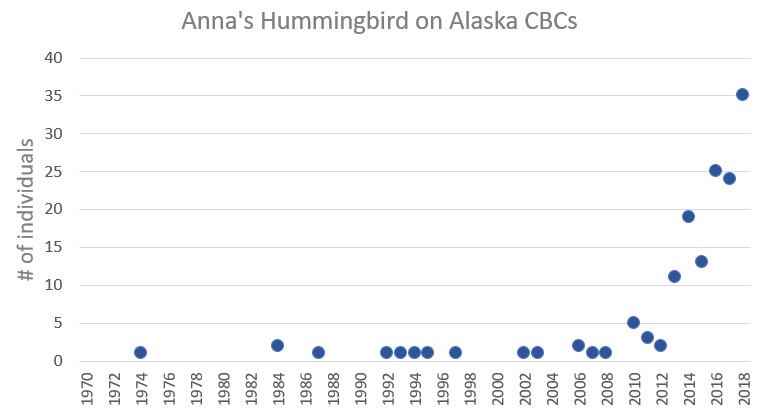
Anna’s Hummingbird
If this invasion has a poster child, it’s the Anna’s Hummingbird, which, in the last 20 years, have become a common feature of the winter birdlife of the Pacific Northwest. Their numbers are still increasing. While much has been written about their affiliation to human habitation with hummingbird feeders and flowering ornamentals, the timing of their expansion is consistent with climate change and shows no sign of abating. Anna’s Hummingbirds are not expanding similarly in the southern portions of their range. The sudden rate of expansion, which is evidenced in most of the species shown here, exceeds the temperature increases, suggesting thresholds are being crossed and new opportunities rapidly filled.

The expansion of the Anna’s Hummingbird has now reached Alaska, where they can be found reliably in winter in ever-increasing numbers.
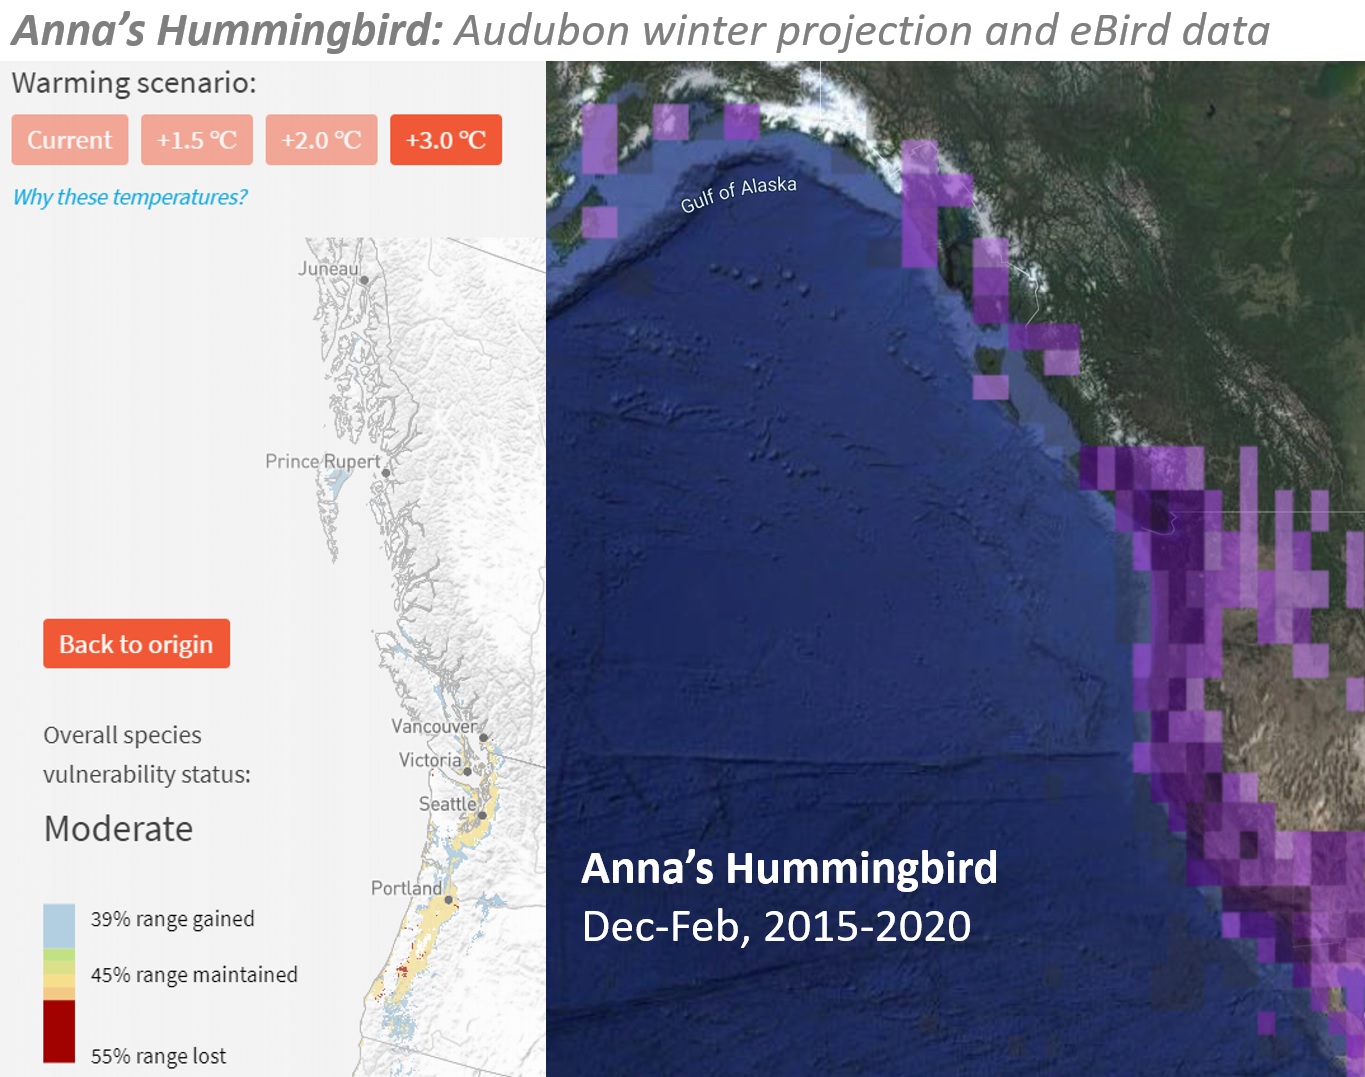
The range expansion of the Anna’s Hummingbird has vastly outpaced even predictions under 3.0C. In addition to extensive inland spread into central Oregon and eastern Washington, they now occur across the Gulf of Alaska to Kodiak Island in winter.
Black Phoebe
Non-migratory insectivores seem to be among the most prevalent species pushing north with warmer winters. The Black Phoebe fits that description perfectly. Oregon has seen an increase from zero to over 500 individuals on their CBCs.
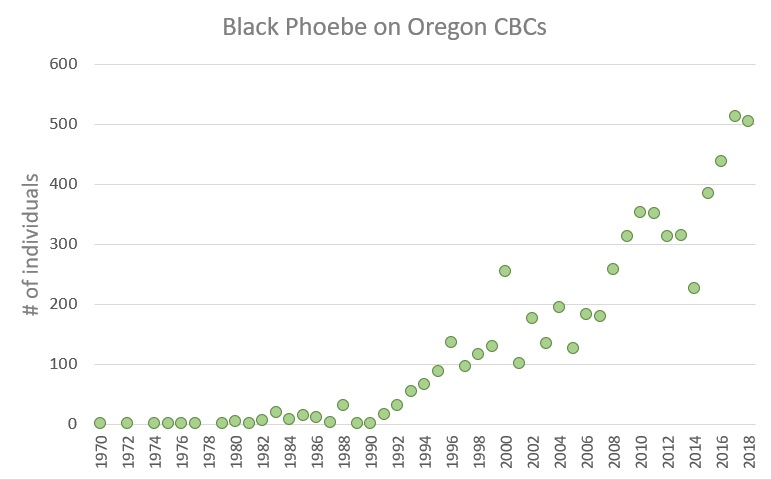
With the same 20-year lag of the Red-shouldered Hawk, the Black Phoebe began its invasion of Washington.

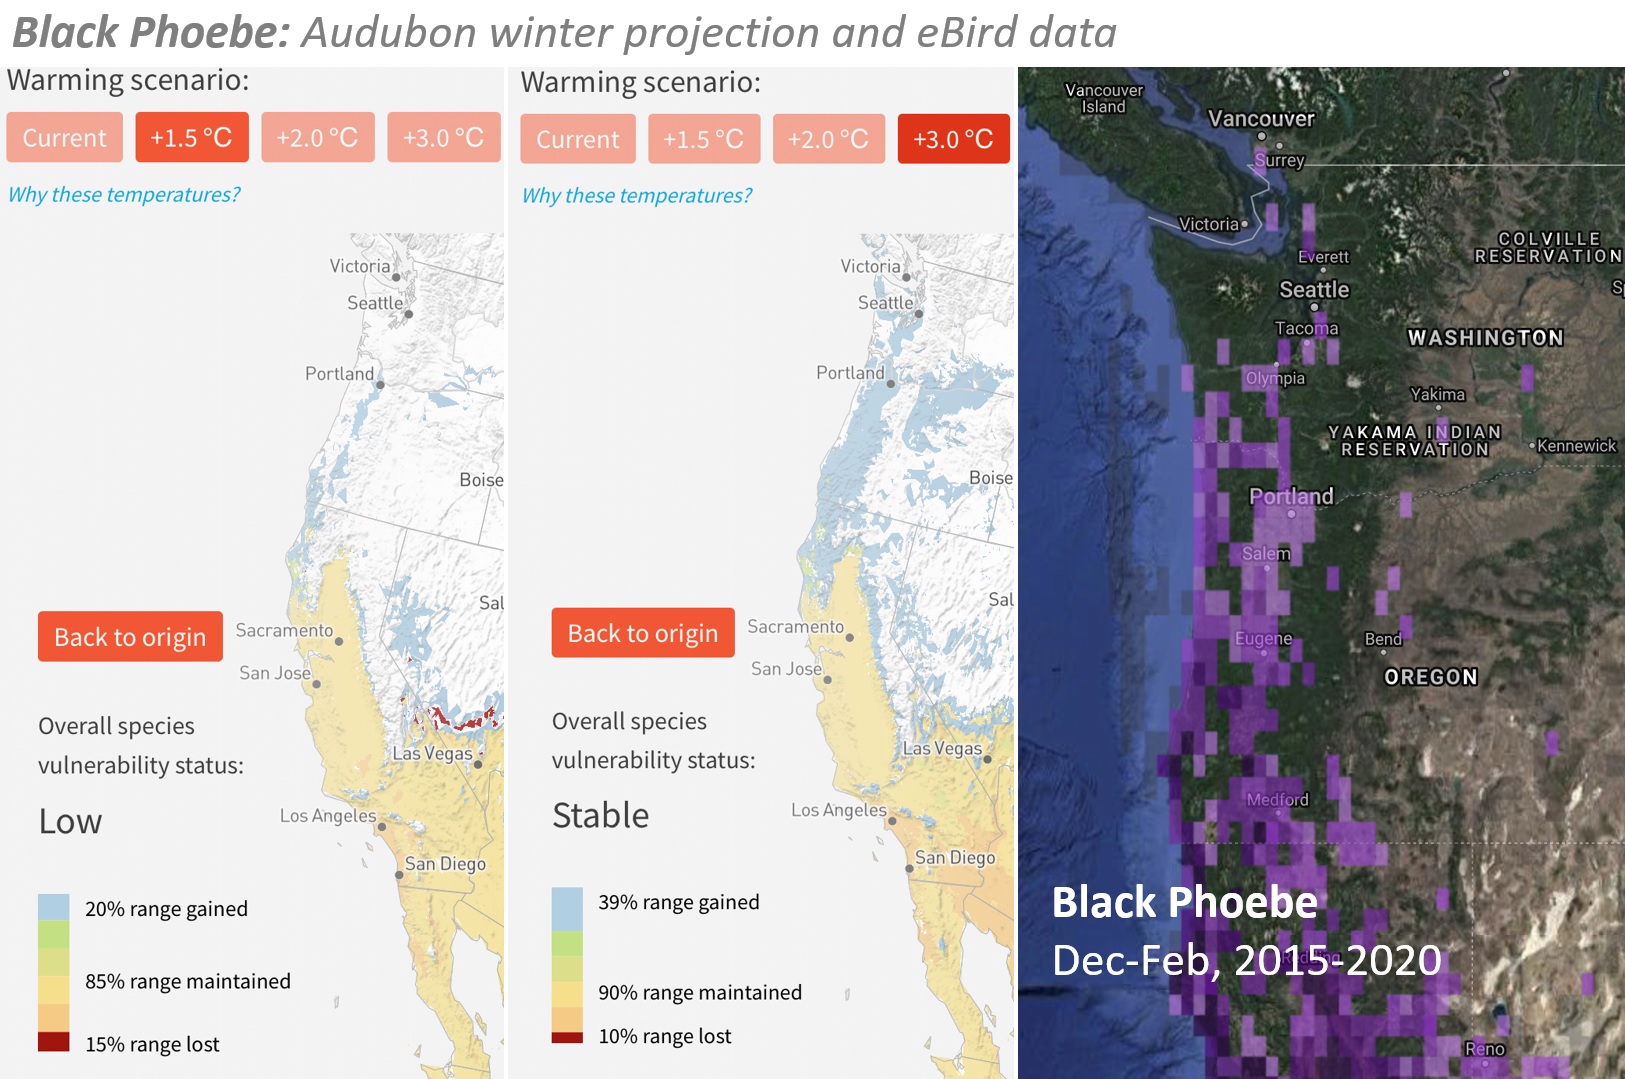
The figure below illustrates two different climate change predictions, using 1.5C and 3.0C warming scenarios. While nearly a third of the Pacific Northwest’s Black Phoebes are in a few locations in southwest Oregon, they are increasingly populating the areas predicted under the 3.0C scenario.
Townsend’s Warbler
Migrant species tend not to show the dramatic range expansions of more resident species – and short-distance migrants show more range changes than do long-distance migrants. Townsend’s Warblers, which winter in large numbers in southern Mexico and Central America, also winter along the California coast. Increasingly, they are over-wintering in Oregon and, to a lesser degree, Washington. This mirrors evidence from northern California, where House Wren, Cassin’s Vireo, and Western Tanager are over-wintering in increasing numbers. These may be next for Oregon.

Townsend’s Warblers are already filling much of the map under the 1.5C warming scenario, though their numbers on CBCs in Washington and British Columbia have yet to take off.

California Scrub-Jay
Due to problems with CBC data-availability, I have no graph for the California Scrub-Jay. Their northward expansion is similar to many of the species above. Their numbers on Washington CBCs have increased from less than 100 in 1998 to 1,125 on the 2018-19 count. eBird data shows they have filled the range predicted under the 3.0C scenario and then some, expanding into eastern Oregon, the Columbia Plateau, and even Idaho.

Other species
Other species which can be expected to follow these trends include Northern Mockingbird and Lesser Goldfinch. (See more on the expansion of the Lesser Goldfinch here.) White-tailed Kite showed a marked increased in the mid-1990s before retracting, which seems to be part of a range-wide decline in the past two decades, perhaps related to other factors.
Curiously, three of the Northwest’s most common resident insectivores, Hutton’s Vireo, Bushtit, and Bewick’s Wren, already established in much of the range shown on the maps above, show little sign of northward expansion or increase within these ranges. The wren is moving up the Okanogan River, and the vireo just began making forays onto the Columbia Plateau. Both of these expansions are predicted.
Likewise, some of California’s oak-dependent species, which would otherwise meet the criteria of resident insectivores (e.g. Oak Titmouse), show little sign of expansion. Oaks are slow-growing trees, which probably limits their ability to move north quickly. Similarly, the Wrentit remains constrained by a barrier it cannot cross—the Columbia River.
Call it the invasion of the Northwest. Call it Californication. Call it climate change or global warming. Regardless, the birds of California are moving north, as predicted and, in some cases, more dramatically than predicted.