A Nazca Booby, a tug, a barge, and a pit: A climate parable

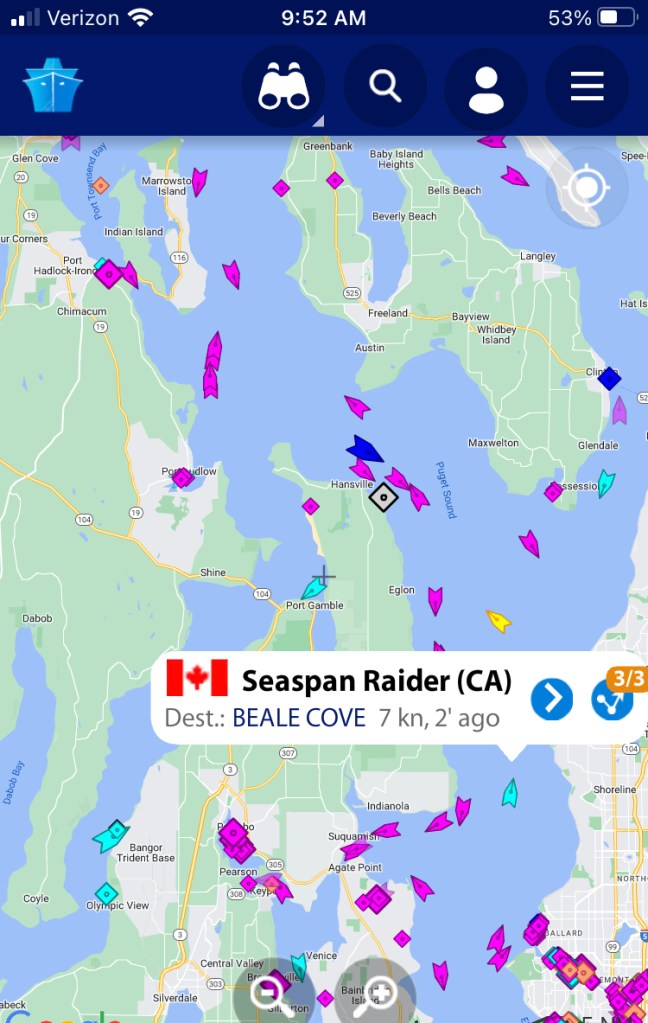
At 9:30am on August 17, that is, yesterday, I got a text from another birder. A Nazca Booby had just been seen from Discovery Point near Seattle. What’s more, we knew exactly where the bird was now; it was perched on the bow of a barge being pulled by the tug Seaspan Raider.

The Nazca Booby, atop the barge, photographed by Matt Stolmeier, captain for Outer Island Excursions.

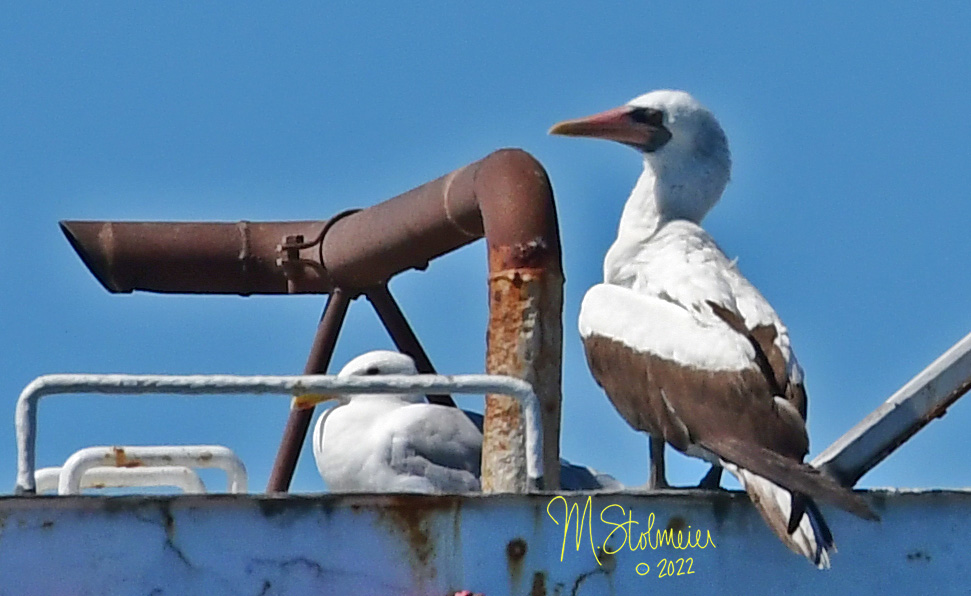
The Nazca Booby is a tropical seabird that breeds exclusively on the Galapagos Islands. When not nesting, it occurs at sea in the eastern Pacific, generally between central Mexico and northern Peru.

Breeding (orange) and non-breeding (blue) range of the Nazca Booby.

This was Washington’s third record. The first, quite possibly the same bird, was on August 14, 2020, in pretty much the same part of Puget Sound. The second was a few weeks ago also off Seattle. That one was an immature, not an adult, so we know it was a different individual. It then showed up off Victoria, providing Canada with its third record.

The Nazca Booby first arrived in the United States in California in 2013. I actually played a role in that first record, a dead beachcast bird found in the aftermath of an oil spill. Working for the state’s spill response, I brought it to the attention of the California Bird Records Committee and had experts examine the carcass for identification. That bird was not a one-off event; it was the beginning of an invasion. There were a few scattered records in the following years, followed by an explosion of 26 records in 2018 and 21 in 2019. After that, California removed the species from its “review list”. While some of these records may have been the same individuals, it is remarkable that a tropical bird previously unheard-of in the US was suddenly widespread. Oregon got its first two records in 2018 and 2019.

Sea surface temperature (SST) of 66.1F off the Washington/Oregon coast.

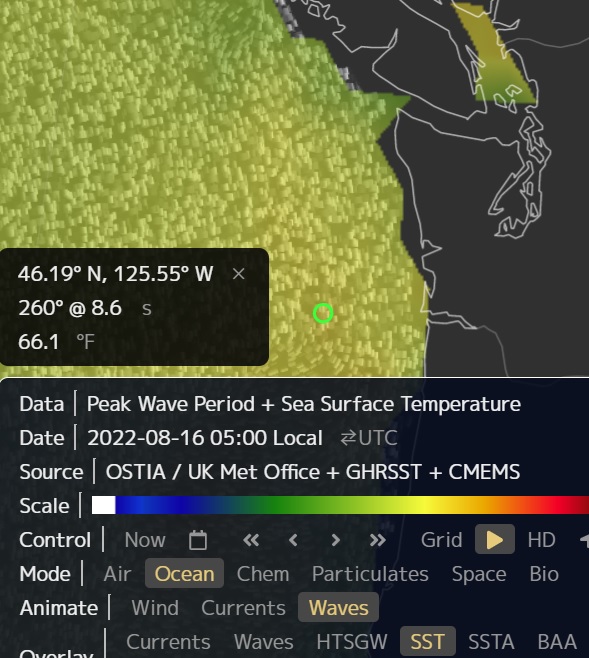
Checking sea surface temperatures, I see that the water off the Washington and Oregon coasts is reaching 66F in places, only 4F cooler than on the south side of the Galapagos. Zooming out, it is easy to see a route from there to here where the bird never had to encounter sea surface temps under 60F. The Strait of Juan de Fuca is in the low 50s, but it does approach 60F near Seattle.

I opened the MarineTraffic app and quickly located the Seaspan Raider. It was southwest of Edmunds, northbound at 7.3 knots. I calculated it would arrive off Port Townsend between 1 and 2pm. Birders scrambled, heading to various coastal promontories on both sides of Puget Sound. I headed to Point Wilson, where Puget Sound effectively ends and meets the Strait of Juan de Fuca. The tug, bound for Canada, would have to pass by me here.

Reports came in. The bird had flown off the barge. It was in the water off Edmunds. It took off. It was seen from both sides. No one knew where it was.

Tracking the tug using the MarineTraffic app.

This wasn’t the only booby in the Salish Sea at the moment. A Brown Booby had been photographed a few days earlier near the San Juans. That was yet another tropical seabird that had already invaded the US, with records from over forty states, including Alaska. Two decades ago, this would have been unimaginable. And this summer, 2022, was already noteworthy across the Midwest and East Coast for the mass invasion of waterbirds typically found only in Florida or the Gulf Coast. Limpkins, Wood Storks, White Ibis, Roseate Spoonbills and many others were showing up hundreds of miles north of their previously known ranges.

Scrolling thru the American Birding Association Rare Bird Alert nationwide posts, limited to just mega-rarities, here is what pops up: Brown Booby in Oklahoma, Neotropic Cormorant in North Carolina, Brown Booby in Wisconsin, two Swallow-tailed Kites in Ohio, Limpkin in Wisconsin, Neotropic Cormorant in Michigan, White Ibis in New York, Wood Stork in Pennsylvania, Heermann’s Gull in Alaska, Limpkin in Illinois, Nazca Booby in California, White Ibis in Nebraska, etc. And that doesn’t even get us back to August 1. These are all birds, mostly aquatic birds, well north of their normal ranges.

Our current rate of climate warming hasn’t been seen since the Paleocene-Eocene Thermal Maximum (PETM) 55 million years ago. Then, there were alligators within the Arctic Circle. Kind of like Nazca Boobies are now a thing in Puget Sound. Actually, our current rate of warming is much faster than then. During the PETM, the climate warmed 5C in five thousand years. The current rate of warming is eighteen times faster. Then, no one would have noticed. Now, there is 1C of warming – and, with it, dramatic changes in climate and ecology – within the lifespan of a single bird. Some seabirds are showing us that they can keep up, thanks to their ability to fly long distances. I’m not sure about the alligators. Or birds that depend, say, on oak trees. The birds can fly, but the oaks can’t.

Two hours passed. I was ready to give up and head home, my only consolation being “MAMU CF”, a Marbled Murrelet making a provisioning flight across the Sound, carrying a fish to its single chick somewhere on a moss-covered Doug fir branch a hundred feet above the forest floor, probably in the Olympic Mountains. I’d only seen that once before. Much of their range in California has been lost to fires in the past five years, so this Olympic chick is important.

The original photo of the Nazca Booby on the barge, by Alex Meilleur.

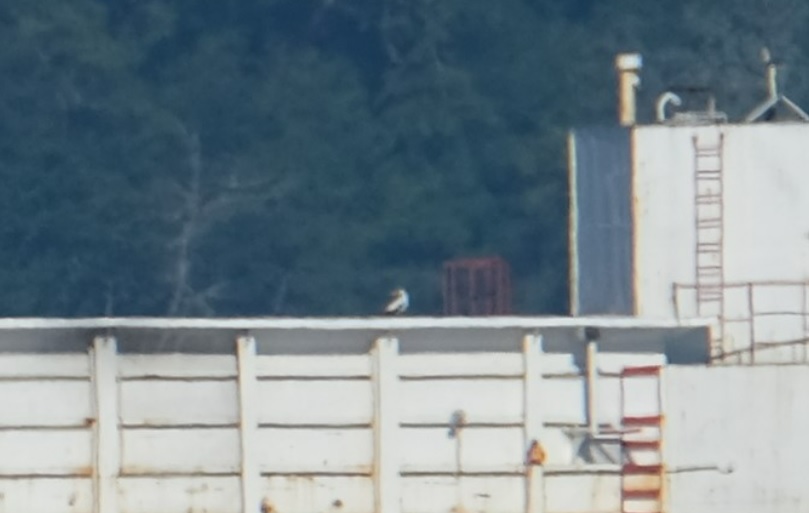
One birder, who was unable to search for the Nazca Booby, called some of the local orca boats, as he worked on some of them. He let them know about the bird, as some were near it. About twenty minutes later, texts came in. They had re-found it! It was back on the same barge, now approaching Marrowstone Point. I spun my scope south. There, beyond the ferry lane, I could make out the red and white structure of the Seaspan Raider, pulling its barge, all blurry and shimmering in the distant heat mirage, slowly chugging toward me.

Taking advantage of the outgoing tide, the Seaspan Raider was now hitting 9 knots. It is powered by two Niigata 6m G25HX diesel engines. I don’t know what kind of gas mileage it gets, but, because it presumably refueled in Washington, most of its fuel is likely conventional diesel, but a small component may be renewable diesel.

Renewable diesel is not the same as biodiesel. Biodiesel can be mixed with conventional diesel, but only in very small amounts, like 2%. Renewable diesel, on the other hand, is molecularly identical to conventional diesel. It’s a relatively new invention. Made from non-petroleum sources, such as plant and animal material, it is to conventional diesel what corn syrup is to sugar; it is a “drop-in ready” alternative fuel. It can be mixed with or substituted for conventional diesel seamlessly, with no change in gas pumps, pipelines, or engines. In fact, it burns slightly cleaner, so engines last longer. It emits fewer particulates and, most importantly, its greenhouse gas footprint is up to 80% less. Its use is already widespread in California, where two of the state’s largest refineries no longer take petroleum crude.

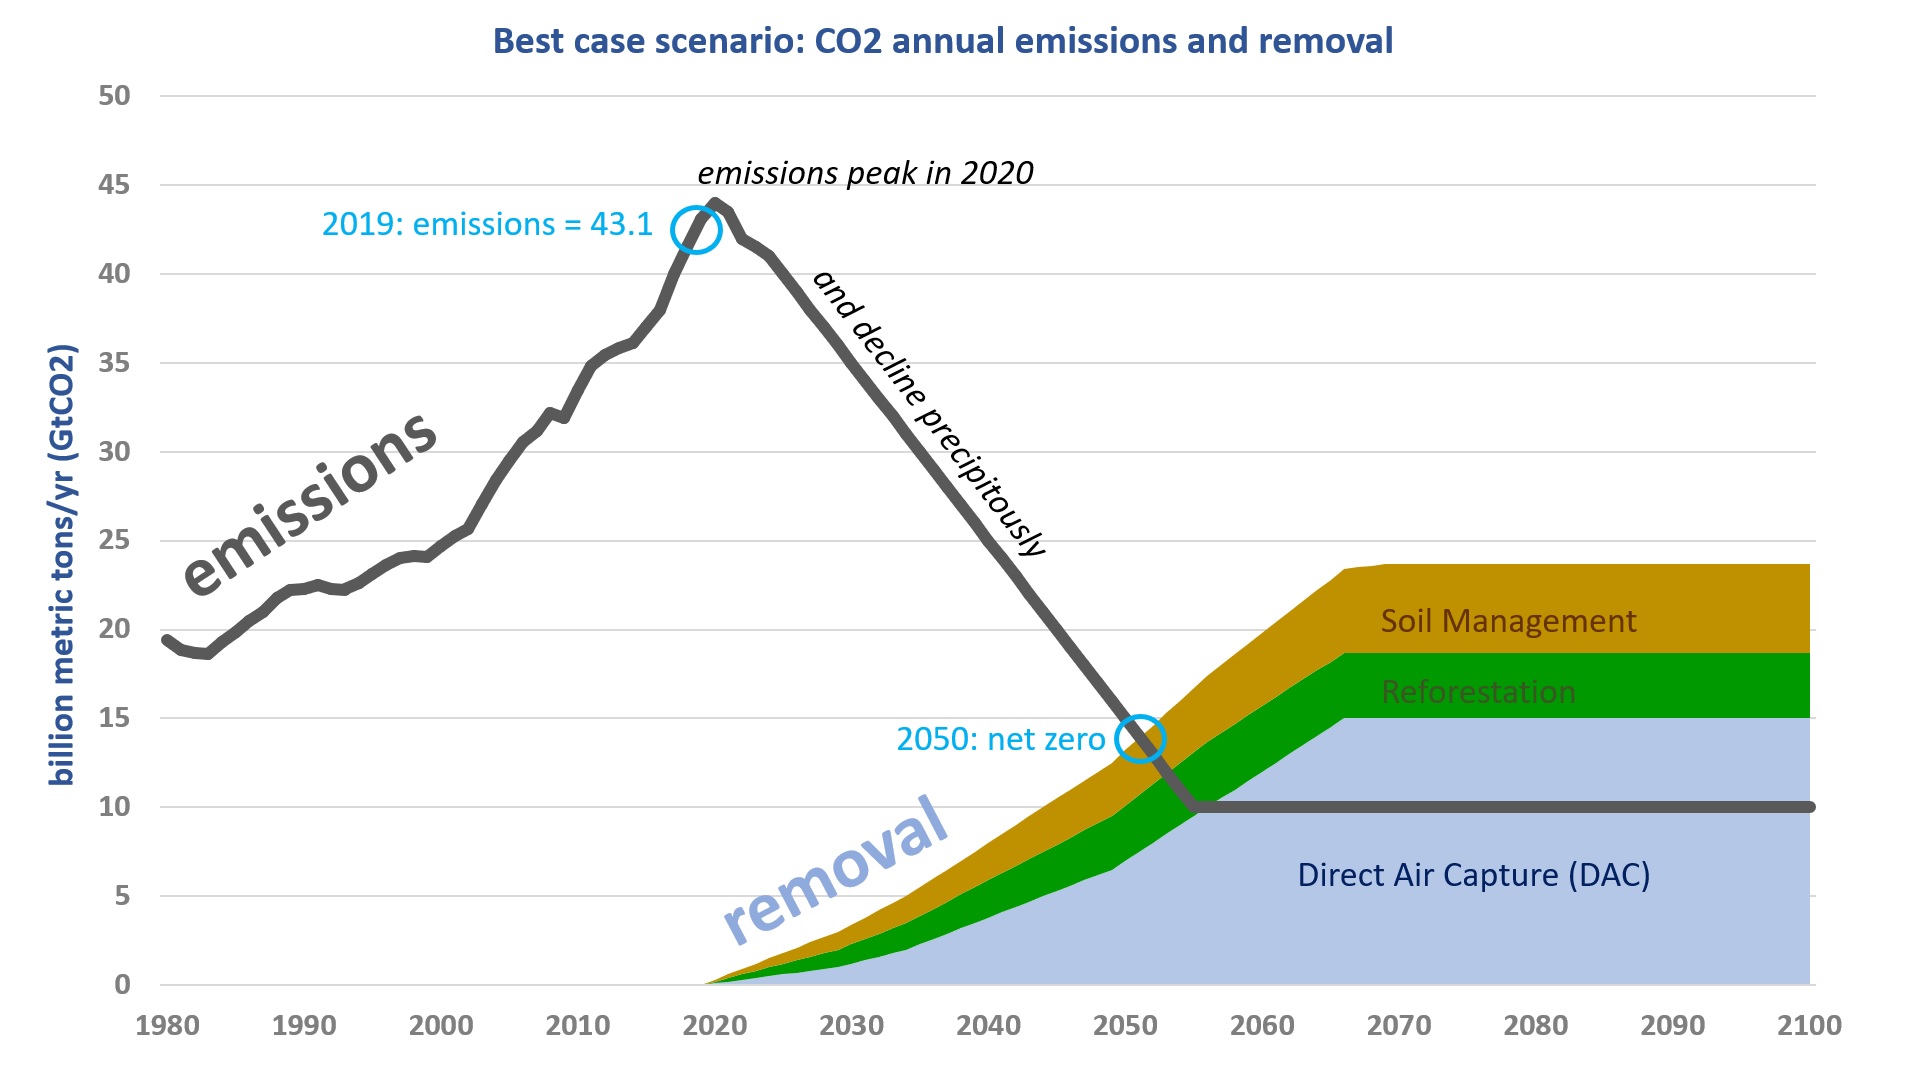
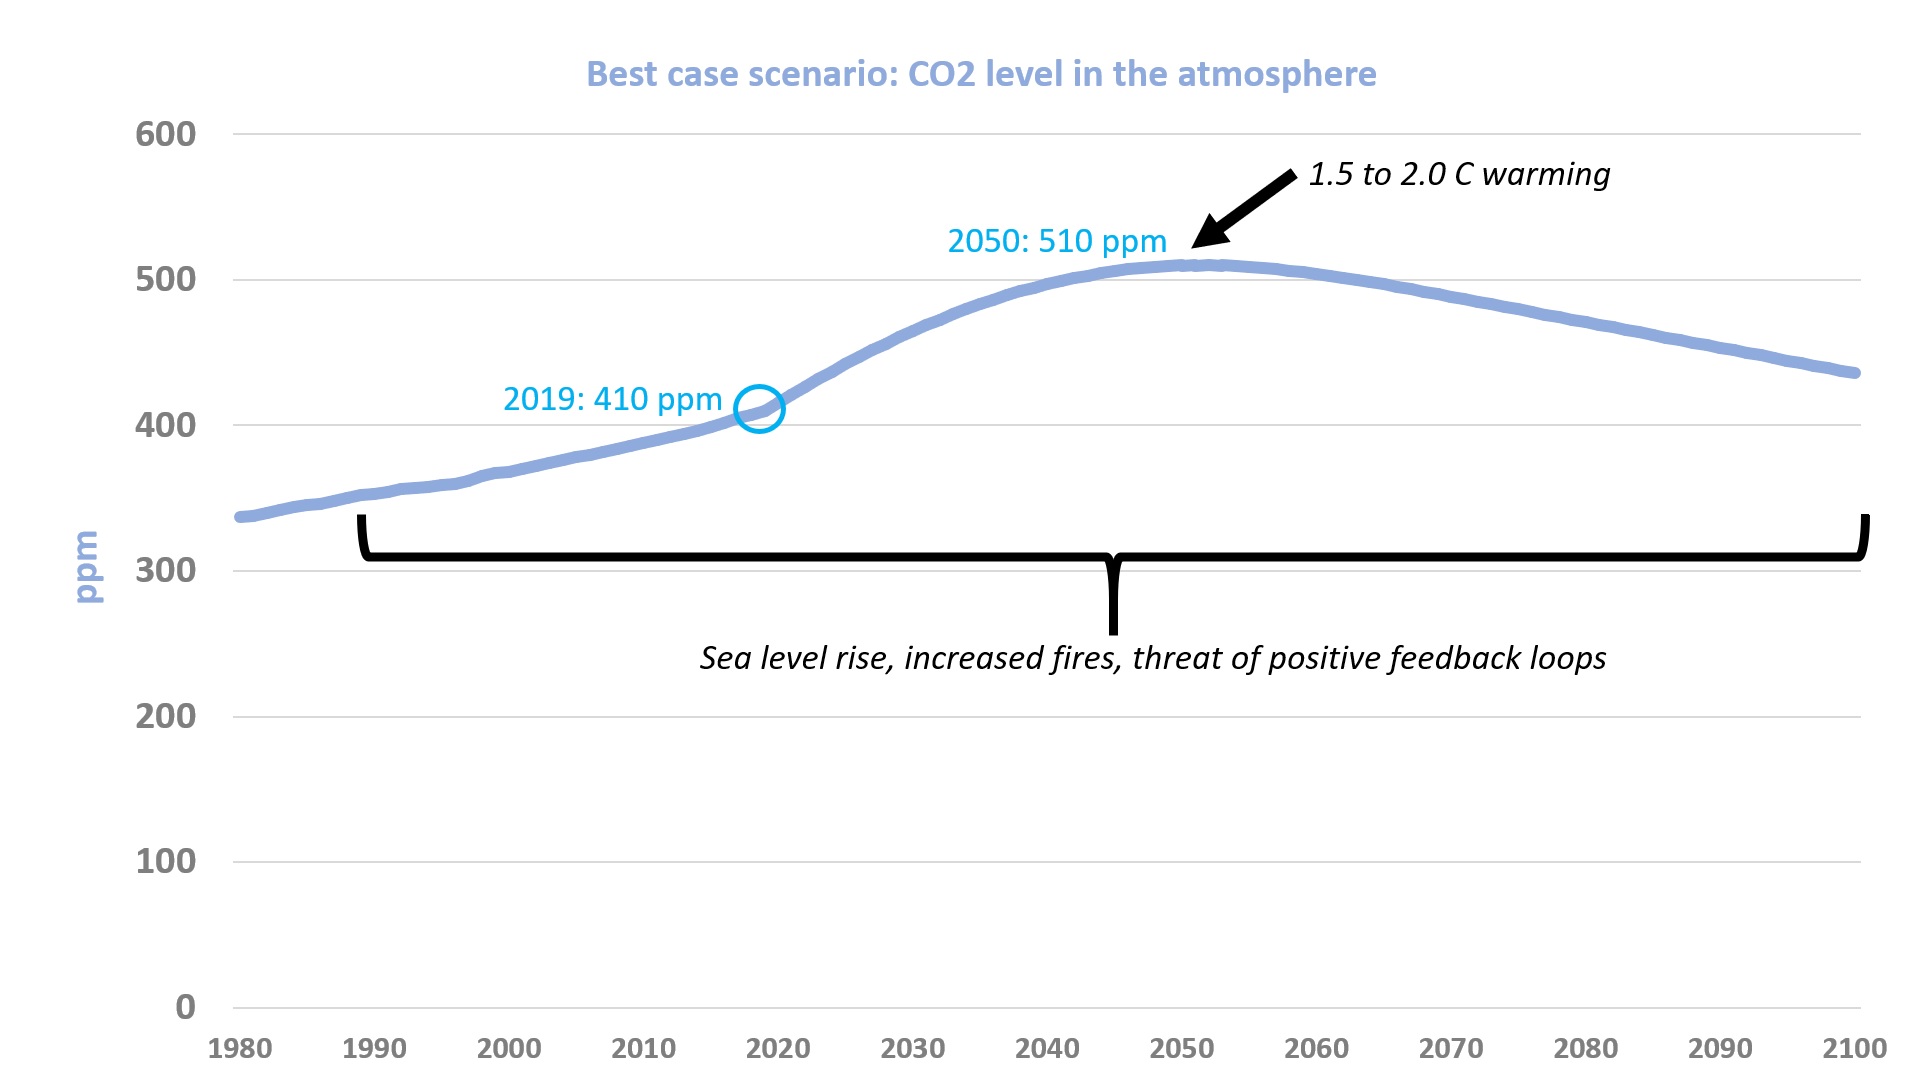
This is the kind of thing that should have been developed thirty years ago, just after James Hansen of NOAA briefed congress on climate change in 1986. Now it’s late. We’ve already had more than 1C of climate warming, with more coming and probably ten feet of sea level rise built into the system. Stopping carbon emissions is no longer a suitable goal. We’ve already pushed the cart down the ramp. It’s rolling. We need to reverse climate change, to change that ramp so the cart rolls back to where it was. That will require actually sucking CO2 out of the air – negative emissions – which will certainly take a hundred years under the most optimistic scenarios. So get ready for more boobies, maybe even Limpkins and alligators.

Aside about Washington: Washington further delayed action a few years ago when the Department of Ecology required an Environmental Impact Statement from Phillips 66 to convert their refinery at Cherry Point to make renewable diesel. That is to say, Phillips needed to jump through major permitting hurdles because they were changing – that is, reducing — their greenhouse gas emissions. Phillips didn’t want to wait the several years required for this, so they promptly moved their operation to California. Governor Inslee tried to intervene and save the project, but it was too late. Now BP is picking up the baton in Washington.

Renewable diesel is already in widespread use in trucks, especially in California. The ferries in San Francisco Bay are powered exclusively by it. Because diesel is similar to jet fuel, and made during the same refining process, refineries also produce what is called sustainable aviation fuel (SAF). Aircraft are currently permitted to fly with up to a 50/50 blend of SAF and conventional jet fuel. Boeing promises jets that can fly with 100% SAF by 2030. We’ll be approaching 1.5C of warming by then. Nazca Booby will almost certainly be off the rare bird review list, at least in California. Brown Boobies will be breeding on the Farallones and prospecting further north.

I watched as orca boats came and went from the barge, photographing the Nazca Booby. I was told it was on the starboard side of the roof of the little structure on the bow. The tug and barge continued up Admiralty Inlet until it was straight out from me, as close as it would pass. Slightly more than halfway across the channel, it remained blurred in heat mirage. I could see fuzzy white dots on the described rooftop, but I couldn’t tell you if they were Nazca Boobies or gulls or volleyballs. In birder’s lingo, this was going to be a ‘dip’, even though I knew exactly where the bird was and was looking at it.

My view of the tug, barge, and bird.

Mathematically, this would be at least the sixth time a Nazca Booby had passed this point, my point, my sea watch. And this time I was here, ready and waiting, and still I couldn’t see it. Were it not for the texts and the orca boats, I’d never know it was there. I kept my scope glued to it, hoping it would lift off in a distinctive flight and head directly toward me, where it would join the Caspian Terns and plunge dive right in front of me as I clicked my camera in ecstasy. But it didn’t. The tug and barge chugged north.

The bird was last seen at Partridge Point on Whidbey Island, still riding the barge. It was off the barge by Rosario Inlet. I’m guessing it jumped ship and headed toward Victoria or Smith Island.

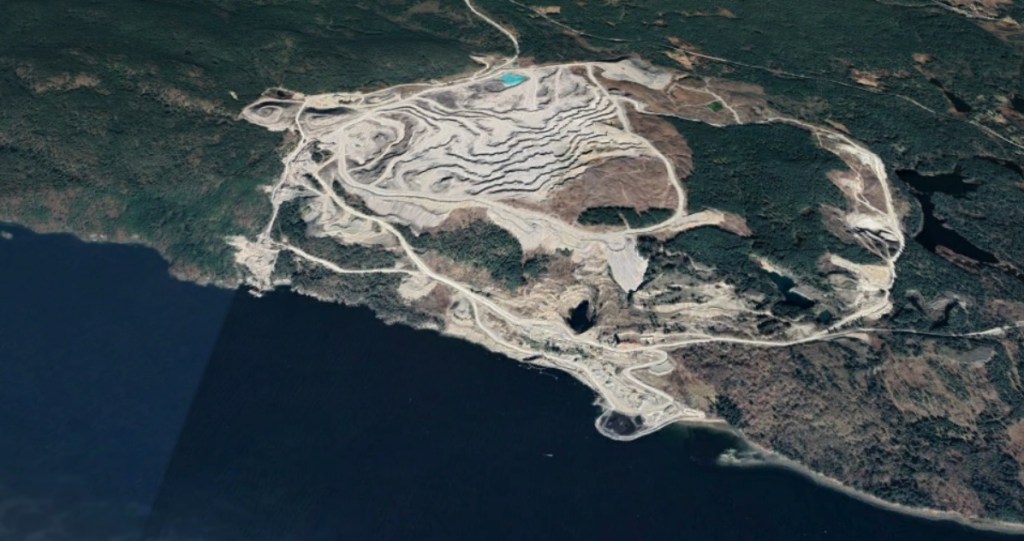
The barge’s destination was the Lafarge Texada Quarrying Ltd. limestone mine north of Vancouver. Limestone is critical to making cement. The cement-making process is responsible for 8% of the world’s carbon emissions. Part of that is from the energy used in production, which requires a kiln heated to 1,400 degrees Celsius. But most of the emissions comes from the limestone itself. Forty percent of the weight of limestone is CO2, and this is burned off in the process. There are efforts to improve the cement-making process, to make it less dependent on limestone, to reduce its carbon emissions. That’s all coming in the future.

The limestone mine at Beale Cove, the barge’s destination.

I’m wondering about the ancient Nazca civilization in what is now Peru. It was dependent on a remarkable network of underground aqueducts that delivered mountain water to their arid home. There’s a theory that they over-harvested a certain tree, which led to erosion of riversides during heavy rains, destroying their water delivery system. I wonder if they had meetings about the problem, if they had new policies in effect, at least at the end, when it was too late.

It’s supposed to be 95F in the Seattle suburbs today. I’m not worried about missing this Nazca Booby. There will be more.

The Nazca Booby on the bow. I’m sure the scope views were better. Photo by Laura Brou.

California’s plan for net-zero by 2045 and net-negative after that

Getting to Neutral cover.jpgIn January 2020, Lawrence Livermore Laboratory released their detailed report Getting to Neutral: Options for Negative Carbon Emissions in California. It provides a detailed plan, with estimated costs, to reach California’s goal of net-zero by 2045, and net-negative thereafter, thus reducing carbon in the atmosphere and potentially returning it to pre-industrial levels.

The plan’s focus is carbon sequestration. For a plan on carbon emissions reductions, see California’s 2017 Climate Change Scoping Plan.

[Note: “ton” always refers to tons of CO2 equivalent (tCO2e).]

The plan relies on three main pillars:

  1. Natural sequestration thru improved land management (sequesters 25 million tons/yr);
  2. Biomass fuels made from forestry and agricultural waste, and garbage, with capture and storage of CO2 (sequesters 83 million tons/yr) (and also displaces the use of fossil fuels);
  3. Direct air capture of carbon, sucking carbon out of the air with large machines (sequesters 17 million tons/yr).
  • Natural sequestration

Chapter 2 focuses on natural solutions, which are among the cheapest options for sequestering carbon. However, they are also all limited by the number of acres upon which we can apply them. There are only so many acres of forests, wetlands, etc. By far, the largest (and cheapest) option in this category is changes in forest management.

Changes in forest management

The easiest way to increase carbon sequestration is to change to the way forests are managed. Specifically, those changes include increasing harvest rotation length, maintaining stocks at a high level, and increasing productivity by removing diseased or suppressed trees. Negative emissions are based on ongoing sequestration of carbon, which may include the transfer of harvested carbon to durable wood products. These practices would sequester 15.5 million tons/yr at a cost of $0.80/ton.

Other natural solutions

Other natural options, in order of the maximum amount of carbon they can sequester, are reforestation, tidal marsh restoration, freshwater wetland restoration, and grassland restoration. These are smaller players—more limited and more expensive. The habitat restoration options are especially limited in their potential contributions and very expensive per ton of CO2 sequestered (although restoration provides other benefits, of course). Together, these options can sequester another 10 million tons/yr at costs that range from $16.4/ton (for reforestation) to $440/ton (freshwater wetland restoration).

  • Biomass fuels

Analogous to current ethanol production, Chapters 3 and 4 call for turning leaves, branches, almond hulls, and human garbage into biofuels, but then also capturing the CO2 and burying it in old oil fields. A small part of the plan includes sequestering, rather than releasing, the CO2 produced during ethanol production. In terms of sequestration, this is the largest plank of the plan. It envisions a massive shift from fossil fuels to plant-based fuels, complete with new pipelines to transport and bury the CO2. It relies heavily on the Central Valley’s agricultural sector and old oil fields. The plan assumes existing crops and does not consider planting crops purely to create biofuels; thus, it does not displace food production.

Because biofuels would displace fossil fuels, it would also result in massive reductions of carbon emissions. However, that is not the focus of the report; the focus of the report is to sequester carbon.

Here is where the biomass would come from:

Forest biomass

Slag from logging, sawdust from sawmills, cleared shrub and chaparral. This would sequester 24 million tons/yr.

Municipal solid waste (household garbage)

This would sequester 13 million tons/yr.

Ag residue

  1. Almond hulls and shells (41% of total ag residue biomass)
  2. orchard and vineyard clippings (30%)
  3. other above-ground plant parts after harvesting from other crops (29%).

These would sequester 13 million tons/yr.

Other

Landfill and anaerobic digester gas. This would sequester 6 million tons/yr.

CLICK TO ENLARGE

Fig11.jpg

All this biomass would be converted, thru various processes (gasification, combustion, fast pyrolysis, hydrothermal liquefaction, and biogas utilization) into various products: hydrogen, grid electricity, liquid fuels (e.g. “gasoline”), biochar, and renewable natural gas.

The cost depends on the biomass collection, transport, biofuel conversion process, and CO2 transport for sequestration. All of these will vary in order to provide a suite of biofuel energy needs (e.g. electricity, transport fuel, etc.). Overall, this biomass fuel network would sequester 83 million tons/yr at an average cost of about $60/ton (ranging from $29-96/ton).

  • Direct Air Capture

Chapter 5 of the report goes into detail about direct air capture (DAC) technology, machines that would suck carbon out of the air and store it in underground (primarily around oil and gas fields in the Central Valley). The report highlights DAC’s unlimited potential in sequestering carbon, but also its high energy demands (and thus expensive cost). In the end, they focus on two main options:

  1. Natural gas-based plants located near underground storage sites. These would still be net-negative.
  2. Geothermal plants (primarily around the Salton Sea), which would require the captured CO2 to be transported a long distance to underground storage sites.

They reject solar and wind-powered DAC as requiring too much land for the energy needed. They do not explore nuclear-powered DAC, such as fourth generation thorium reactors.

All of Chapter 6 is dedicated to long-term geologic storage. They conclude that oil and gas fields in the Central Valley offer the greatest promise, and that “these areas will be safe and effective storage sites. At depths below 3,000 feet, CO2 converts to a liquid-like form that has about the same density and viscosity as oil.”

Their initial cost estimates for DAC exceed $200/ton, though they assume, with learning, an eventual cost of $190/ton.

The Whole System

Fig60.jpgChapter 7 dives into the logistical details and infrastructure needed to connect the gathered biomass to the biomass fuel plants and the DAC plants to underground storage reservoirs. Among their main conclusions:

  • Transportation is a relatively small portion of total system cost, between $10 and $20/ton of CO2 removed.
  • Preexisting rail would the most efficient way to move collected biomass to biomass fuel plants, though some short spur lines would need to be constructed, depending on plant location.
  • A CO2 pipeline would need to be constructed along existing pipeline corridors in the Central Valley and to the Salton Sea, but not elsewhere.

Chapter 8 explores technology learning curves and cost reductions over time, mostly with respect to DAC.

Chapter 9 explores total system cost under several scenarios. They note there is “considerable flexibility among the technology pathways and scenario options.” Table 40 offers the optimum combination of technologies, sequestering 125 million tons per year (and avoiding another 62 million tons in emissions avoided) for a total of $8.1 billion/year, which is an a total average cost of about $65/ton.

CLICK TO ENLARGE

Fig77.jpg

The Role of State Government

There is a plan for California; will it be implemented?

The report does not go into specific policy initiatives or economic incentives necessary to jump start, implement, or transition to this plan. I will address that in another post. Their only mention of public policy is with regard to the CO2 pipeline, where the report notes: “industry experts have expressed concern about the costs and legal difficulties of obtaining rights-of-way for new pipelines in California. One power company shared that running CO2 pipelines on existing natural gas rights-of-way requires renegotiating with the landowners because CO2 pipelines are higher pressure and thus are not covered by existing agreements.”

Direct Air Capture: How the fight against climate change will be won or lost

Fifteen years from now, when the Great Barrier Reef is a thing of the past, when downtown Atlantic City, Bangkok, Boston, Charleston, Dhaka, Galveston, Honolulu, Jakarta, Lagos, Manhattan, Miami, Mumbai, New Orleans, Newark, Rotterdam, San Francisco, Seattle, Tampa, and Venice relocate, and when Australia and California burn, everyone — from farmers to stock brokers, peasants to politicians– will be asking the same question: Are the machines working?

DAC.jpg

Those machines will be sucking carbon out of the air and burying it deep in the ground or under the sea. We don’t know exactly where they will be, what they will look like, or even how well they will work. All we know is that we need them (Lackner et al 2013).

Reducing our carbon emissions, which humans have proved incapable of, is not enough now. Even reducing to zero emissions tomorrow is insufficient. We are too far gone in the wrong direction. What’s more, like a ship heading for the end of the world where the water falls off the edge, our foot is still on the accelerator. Slowing down is good, but insufficient to avert disaster; we must turn the ship around and head the other way. We need to not just reduce emissions, we need to reduce the amount of CO2 already in the atmosphere. That means negative emissions– sucking carbon out of the air.

Direct Air Capture vs Flue Capture; Sequestration vs Re-Use

Carbon capture from ambient air, also called Direct Air Capture (DAC), is different from conventional carbon capture at factory chimney flues (i.e. point source carbon capture). First, it’s a lot easier to capture carbon from flues because the CO2 is concentrated. Second, typically the goal of flue carbon capture is to minimize CO2 emissions and often to re-use the CO2 in a process that reduces the need for fossil fuels. If it is re-purposed, you’ve reduced CO2 emissions from fossil fuels, but the CO2 is still released into the atmosphere. This is a process to reduce emissions; it is not net-negative.

There are also plans to capture carbon, from the air or from flues, and use it in a variety of other industrial processes, from putting bubbles in soda to (wait for it)… extracting more oil. These plans are merely meant to reduce emissions and also to incentivize the private sector to capture carbon. But it’s not net-negative.

Feasibility

Back to direct air capture. Here’s the catch: we don’t know if we can do it at the scale needed. Fortunately, humans have been much better at finding technological solutions than political ones. There are more than a dozen pilot projects in Iceland, Switzerland, and elsewhere showing it can be done– on a very small scale. There are a host of questions, but the biggest challenge is sucking it out of the air in an efficient and cost-effective way.

Funding

Feasibility aside, there’s the question of how to pay for it. Suppose we wanted to capture and sequester 7 billion metric tons of CO2 annually, which is the IPCC goal by 2050. Currently we emit 43 billion. Early estimates are that it would cost $700 billion/year (at $100/ton) and require an enormous amount of energy, up to a 12% of annual worldwide energy use. But those are early estimates. Technology gets better and cheaper with time. The Center for Negative Carbon Emissions at Arizona State University thinks it can be done for $210 billion/yr (using $30/ton) and require only 1% of worldwide energy use.

For context, worldwide military spending is $1.8 trillion/yr (or $1,800 billion), nearly half of which is by the US. If the armies of the world ever wanted to save a city, let alone a village, they have the money to do it.

Ultimately, governments will have to pay for carbon capture and sequestration. There is no way to incentivize the private sector to bury a product rather than re-use it. In the near term, we can benefit from private sector carbon capture and re-use because, although it is not net-negative, it can incentivize research into DAC technology. And it does reduce emissions.

DAC on a meaningful level requires international coordination and, of course, cost sharing. The two most obvious models would be to apportion cost share based on current or past CO2 emissions.

Each nation will likely be up to its own to develop their own funding mechanism. A carbon tax is an obvious solution. If DAC costs $100/ton, that translates to 88 cents/gallon at the pump. Other fossil fuel uses would also have to be taxed as well. While this sounds affordable, there are two complicating factors: 1) we can’t just address the gallons of gas we are buying now; we have to address all the gas we have ever bought and all our parents have ever bought; and 2) carbon taxes are regressive, hitting the poor more than the rich (as a percentage of their income). There are ways around that, a subject for another blog post.

The enormity of the task means that technological innovations to lower the cost are critical. This should not be left to small policy initiatives like research grants and tax incentives. This requires the full weight of all the major governments and universities in the world. Progressive governments in Europe and California (where Democrats have super-majorities in both houses of the legislature) could and should embark on DAC projects immediately.

The Free Rider and Moral Hazard Problems

CO2 released anywhere in the world spreads everywhere, and DAC done anywhere reduces CO2 everywhere. This is both good and bad. It means that DAC can be done anywhere, allowing us to select the most expedient locations. For example, a DAC pilot study in Iceland uses clean geothermal energy to capture carbon and inject it into porous volcanic rocks.

But it also means there’s a potential free rider problem, where countries will shirk their obligations in the hopes that others will take care of it for them. One can imagine rogue nations that refuse to pay their fair share and free ride on the public service provided by other countries. The US, whose share would be large by any measure, is a candidate for such recalcitrant behavior. Public support for DAC could overcome this.

It is possible that Republicans would support DAC. The US Congress recently passed a $50/ton tax credit for DAC removal, the most ambitious such incentive in the world. Republican support, however, probably came from the associated $35/ton tax credit for carbon captured from the air and used for enhanced oil extraction. Regardless, Republicans could see DAC as an opportunity to extend fossil fuel use into the future. And therein lies the moral hazard problem. If we’re doing DAC, one could argue that we don’t need to reduce emissions as much. And if DAC became cheap and easy, fossil fuel use (aside from the spill risks and air quality impacts) could arguably continue.

But, like with a penny saved rather than earned, carbon not emitted is carbon you don’t have to capture and sequester. There are two more reasons why reducing emissions must still happen: 1) at the moment, it’s still cheaper to reduce CO2 emissions than to capture it; and 2) we are nearing the edge of the world, when it’s too late even to capture carbon.

Positive Feedback Loops

This brings us to the gremlins in the room– positive feedback loops. These are additional sources of global warming that are caused by the current global warming. They are force multipliers, accelerators, that can make global warming much worse very fast. It’s hard to predict when they will kick in. If they do, our job will become much much harder. We will lose ground, a lot more ground (read human suffering) before we win. They put victory in doubt.

Some positive feedback loops, such as increased water vapor in the air and dark seas and mountains exposed from melting ice and glaciers, have been accounted for in climate models. More pernicious are the more unpredictable “time bombs”, such as permafrost melt and massive wildfires.

Melting permafrost is the proverbial elephant of the gremlins in the room. Research suggests that rapid methane releases from melting permafrost may have been the final driver in runaway climate change that led to past mass extinction events, including the End-Permian Extinction in which 97% of all life on earth perished. This effect is already happening. NOAA recently reported that melting permafrost now contributes as much as net 0.6 billion tons of carbon (equivalent to 2.2 billion tons of CO2) to the atmosphere each year; “the feedback to accelerating climate change may already be underway.”

Forests are normally carbon sinks, taking in CO2. However, in 2006 Westerling et al warned that “forests of the western United States may become a source of increased atmospheric carbon dioxide rather than a sink, even under a relatively modest temperature-increase scenario.” Since then, wildfires have increased dramatically.

These positive feedback loops are like an increasing current threatening to pull the ship over the falls. If we are waiting for technology to save us, we may have waited too long.

Controlling the Climate

In the long run, Homo sapiens might eventually hopefully maybe win the climate battle and be able to capture and sequester enough carbon to return the earth’s atmosphere to normal conditions. But there will be suffering in the short-term, for the next two hundred years, thru sea level rise, heat waves, droughts, powerful hurricanes, and agricultural disruption. The poor will suffer most. Turning the climate around is like turning a cruise ship. There’s a lot of lag time between cause and effect. That’s why humans have found themselves in the current crisis. Only the scientists saw it coming. Nobody felt the impacts until now, and now it’s too late to avoid them. The same is true regarding corrective measures. A lot of sea level rise, caused by ice melt in Greenland and Antarctica, is already built into the system. It is coming and coming at an increasing and exponential rate. We may have to actually cool the planet beyond the recent historic level to stop it. And that may take 150 years. In the meantime, hundreds of coastal cities will go under water. This appears inevitable, even under the most optimistic scenarios.

The graphs below present the most wildly optimistic scenario, achieving the Paris goal’s peak emission in 2020 (this year), DAC of 7 billion tons of CO2 per year by 2050, plus optimistic net removal thru reforestation and new soil management practices, all of which help to get us to net-zero emissions by 2050, another Paris goal. After that, we remove more than we emit; we are net-negative, returning the earth to under 400 ppm.

It would be great to just use natural approaches to sequester carbon (e.g. reforestation and soil management). But the numbers just don’t add up fast enough. During past global warming events (e.g. the Paleocene Eocene Thermal Maximum), it took the earth’s natural processes tens of thousands of years to restore balance. We have put so much carbon up so fast thru industrial processes that we need the same kind of speed sucking it back in. Nevertheless, looking at the graph below, reduced carbon emissions are still the biggest player, followed by DAC and the natural processes. We need it all to the maximum extent possible as soon as possible.

But this wildly optimistic scenario still has us peaking at 510 ppm in 2050, high enough to hit 2.0 Celsius warming, which is perilously close to unleashing enough carbon and methane from permafrost and other positive feedback loops to launch us toward 3 or 4 or 5 C warming and create another mass extinction event  (which we know from the past the world will recover from, re-evolving new life forms, in a few million years).

DAC chart1.jpg

The graph of CO2 levels below is derived from the assumptions regarding CO2 emissions and removal above. This is a best case scenario.

But suppose humanity gets past this. Successful implementation of carbon capture and sequestration would mean that Homo sapiens can control the earth’s climate. That brings with it a host of other questions. At what level do we set atmospheric CO2? Do we return to 300 ppm or lower? Who decides? Because carbon released or captured anywhere affects everywhere, who will police it? These are questions for our children, if they are fortunate.

Modern climate change is 10x faster than historic global warming mass extinction events

There have been several mass extinction events in the history of the earth, most of them caused by global warming due to “sudden” releases of carbon into the atmosphere, and it only took an increase of 4 to 5 degrees Celsius to cause the cataclysm. The current carbon emissions rate is 10 to 100x faster than during those events. And we’re already a quarter of the way there in terms of warming.

CLICK TO ENLARGEemissions rate

The current warming trends, RCP 8.5 and RCP 4.5, refer to estimates of carbon emissions under high and moderately low projections by the International Panel on Climate Change. The straight lines on the extinction events are approximate; there may have been episodic spurts and stops as different thresholds, positive feedback loops, and other natural events occurred. But these lines connect the dots we have.

The earth is 4.5 billion years old. Land animals with backbones didn’t really evolve until 300 million years ago (mya), so we’ll start there.

The most massive mass extinction event in the history of the earth was the End-Permian extinction event (also known as the Permian-Triassic extinction event or the Great Dying) 252 mya. It was caused by a massive release of carbon. The equatorial regions, both on land and in the ocean, were too hot for most life forms, including plants. The cause of the warming event is debated, but was most likely due to a series of volcanic eruptions from the Siberian Traps that lasted two million years. The extinction occurred during an initial 60,000 year period, which is “sudden” in geologic terms. Recovery of the ecosystem, basically a whole new evolutionary period to create new animals, took 2 to 10 million years.

The End-Triassic extinction event came next, 201 mya. It was also associated with volcanic activity and the massive release of carbon, this time from the mid-Atlantic ridge. It probably triggered a positive feedback loop, with melting permafrost releasing tons of methane. The extinction period, affecting plants and animals, lasted about 10,000 years and paved the way for the rise of the dinosaurs.

The dinosaurs dominated after that, until all but the avian dinosaurs (the ones that evolved into birds) were wiped out by another mass extinction event 66 mya. This may have been caused by a comet or asteroid striking the earth, or by extreme volcanic activity creating global warming similar to the other events here (8 degrees Celsius over 40,000 years). This one is not shown on the graph.

Finally, there was the Paleocene-Eocene Thermal Maximum (PETM) and associated extinction event 56 mya. Likely caused by a combination of carbon and methane releases, this global warming event is the most recent, offers the most evidence and information, and is most analogous to climate change today. The continents were in roughly similar positions as today. The warming, 5 degrees Celsius in about 5,000 years, wiped out much benthic marine life, pushed the tropics to Wyoming and alligators to the Arctic Circle, warmed oceans to 97 degrees, and made the equatorial regions too hot for many species. The PETM is well-studied, with hundreds of papers available on-line, plus quite a bit of media coverage.

The high temperatures lasted for about 20,000 years. Eventually, the Arctic Ocean became covered with algae. These algae slowly absorbed CO2. When it died, it sank, taking the carbon with it to the bottom of the sea, lowering the carbon in the atmosphere and cooling the earth back to normal. This process took 200,000 years.

Climate change during these past events, considered rapid in geologic time, would have scarcely been noticed by animals on the ground. Animals didn’t go extinct by dropping dead; they just had a lower reproductive rate such that their populations slowly declined until none were left. Also, they evolved. In fact, there was a pulse of evolution during the PETM, producing, among other things, the first primates.

The current warming is 10 times faster than during the PETM. It is noticeable within the lifespan of an individual animal. Adaption thru evolution is not an option. Scientists mince no words:

“We conclude that, given currently available records, the present anthropogenic carbon release rate is unprecedented during the past 66 million years. We suggest that such a ‘no-analogue’ state represents a fundamental challenge in constraining future climate projections. Also, future ecosystem disruptions are likely to exceed the relatively limited extinctions observed at the PETM.”  – Zeebe (2016)

The PETM raised average earth surface temperatures 5 C. We’re at 1.1 C now, with probably up to 2 C already built into the system, meaning we’ll reach that even if we stop all carbon emissions tomorrow. We’re likely to reach 2 C even if we dramatically reduce emissions and successfully implement Direct Air Capture of ambient CO2 in the atmosphere. Assuming business as usual, we may reach PETM levels in 140 years.

Note: See hyperlinks for sources.

The international climate report in three diagrams: The world at a crossroads

On October 6, 2018, the Intergovernmental Panel on Climate Change (IPCC) issued its Special Report on Global Warming of 1.5 °C (known at “SR15”), looking at the benefits of keeping global warming under 1.5 °C, as compared to 2.0 °C, and the potential pathways to get there. The report was commissioned after the Paris Agreement of 2015, which subjected nearly every nation in the world to voluntary goals for reducing greenhouse gas emissions. We are already at 1.0 °C and climbing, so this is a late-in-the-game analysis.

The results, based on the latest science, are sobering. While past IPCC reports were known for being rather conservative, largely due to political pressure, this one is more direct, practically screaming for a radical reduction in fossil fuel use (which must fall to near zero by 2060 even with a technological breakthrough in carbon sequestration). When it was approved, participating scientists cried tears of joy that their report, dire as it is, was allowed to be published as it was.

The full report, a little over 1,000 pages, is available in chapters here.  It provides important details regarding the effects of climate change from region to region.

A 34-page summary for policy-makers is available here.

But even that summary is full of technical jargon that most politicians and members of the public would find cumbersome. Here I’ve taken some of the most important diagrams from the summary and modified and annotated them.  Here is the report in three diagrams:

[CLICK TO ENLARGE]

IPCC1


IPCC2


IPCC3