The Limpkin explosion: Like an invasive species in a changed world

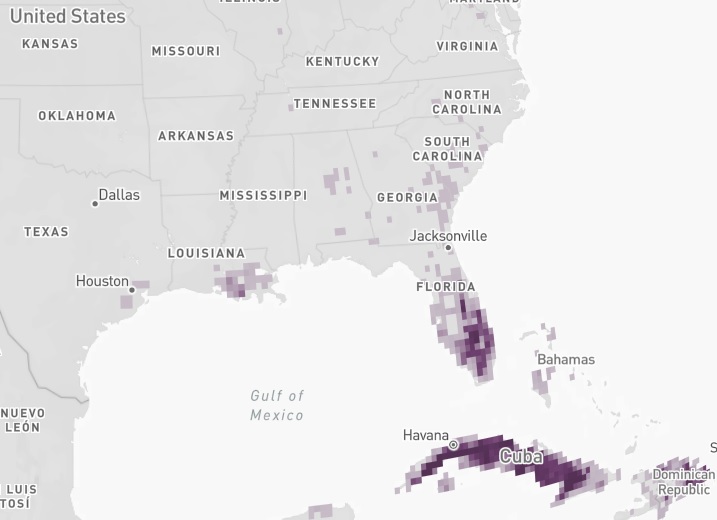
When this field guide was published in 1966, it was clear from the range map that, if I wanted to see a Limpkin in the US, I had to go to Florida.

Limpkin species account from 1966 Golden Field Guide.
The Limpkin range map from this popular 1966 field guide.

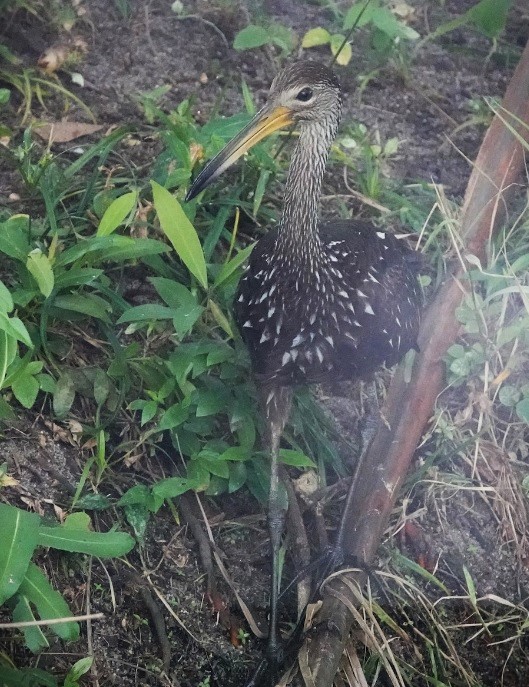
Growing up as a kid birder in the 1970s, this was one of my first field guides. I did not see my first Limpkin until decades later, in 2005. At that time, this freshwater snail and mussel specialist was still largely a Florida bird, with only a scattering of records north of their usual range.

Limpkin records north of Charleston, SC up thru 2015
Extra-limital records up thru 2015 (on eBird).

Between 1956 and 2015, eBird shows only 18 Limpkin sightings north of Charleston, South Carolina, though presumably some historical records have not been entered. Suffice it to say, a Limpkin in this region was a rarity. There were no Gulf Coast records in Texas, Louisiana, Mississippi, or Alabama, and only a few in the Florida panhandle west of the Tallahassee area.

Suddenly, all this changed. 2019 saw records from Illinois, Ohio, Virginia, and coastal Louisiana, in addition to dozens of records from Alabama, Georgia, and South Carolina. 2020 and 2021 added a scattering of records from Texas to Minnesota(!) to Maryland.

Extralimital Limpkin records across the eastern US in 2022 and 2023 (so far)
The remarkable Limpkin invasion so far.

In 2022, they simply exploded, with first state records across much of the continent. 2023 looks like it is picking up where last year left off.

This kind of rapid range expansion is typically seen in invasive species who are introduced into a new ecosystem. They either die out or explode. The Limpkin invasion, however, is not because they have just arrived in Florida — they are a native species — but because the ecosystem north of Florida has been transformed by a warming climate. It is as if they have landed on a new continent. They are following food — an invasive apple snail, as well as freshwater mussels.

This kind of poleward range expansion is predicted with climate change and has already been documented in hundreds of species. See, for example, my posts here:

And these scientific papers:

  •  Amano et al. 2020. Responses of global waterbird populations to climate change vary with latitude. 10: 959-964.Chen et al. 2011. Rapid range shifts of species associated with high levels of climate warming. Science 333 (6045): 1024-1026.
  • Devictor et al 2008. Birds are tracking climate warming, but not fast enough. Proc. R. Soc. B 275, 2743–2748.
  • Hitch and Leberg. 2007. Breeding distributions of North American bird species moving north as a result of climate change. Conservation Biology 21(2): 534-9.
  • Langham et al 2015. Conservation status of North American birds in the face of future climate change. PLoS ONE 10(9): e0135350.
  • La Sorte, F.A., and F.R. Thompson III. 2007. Poleward shifts in winter ranges of North American birds. Ecology 88(7):1803–1812.
  • La Sorte FA and Jetz W. 2012.  Tracking of climatic niche boundaries under recent climate change.  J Anim Ecol. 81(4): 914-25.
  • Prince, K. and B. Zuckerberg. 2015. Climate change in our backyards: the reshuffling of North America’s winter bird communities. Global Change Biology 21(2): 572-585.
  • Stephens et al 2016. Consistent response of bird populations to climate change on two continents. Science 352(6281): 84-7.
  • Virkkala, R. and A. Lehikoinen 2014. Patterns of climate-induced density shifts of species: poleward shifts faster in northern boreal birds than in southern birds. Global Change Biology 20: 2995–3003.

[A more complete list of academic papers about birds and climate change, with highlighted abstracts, is available in the Documents section of the Birds and Climate Change Facebook group.]

Like many birds with expanding ranges, Limpkins have been slowly recovering for decades from historic habitat impacts. There are historic records (from the 1800s) from Georgia, which they did not occupy again meaningfully until 1994. Likewise, expansion into the Florida panhandle was not until the late 1980s. This fits the typical climate change pattern, with ecosystem changes beginning in the mid to late 1980s. Range expansions, however, can be variable, with different species crossing ecological and climatological thresholds at different times.

eBird status map for Limpkin
The current eBird status map for Limpkins shows them as regular from Houston to North Carolina.

Like most of the species shifting their ranges, Limpkins are generally non-migratory, though may have some seasonal movements based on water levels and foraging conditions. Most the recent northern records have been in summer. It is not known if these birds return south in fall, or die, not being able to withstand the winter. That said, they are undoubtedly establishing year-round presence in southern Louisiana (where the first state record was in 2018), and likely from Texas to South Carolina. There are recent winter records from Iowa, Ohio, Oklahoma, Kentucky, and Virginia.

Limpkin southward expansion in Argentina and Chile
The Limpkin may be one of the few species expanding poleward in both directions.

The Limpkin also ranges south into Central and South America. Its scientific name is Aramus guaranauna, the latter part being the Tupí name for it. Until 2018, it did not occur south of Bahia Blanca, Argentina (at least not in eBird). Its core range ended closer to Buenos Aires. However, with a record in 2018 and four more in 2020 (based on eBird, which is used less in South America), it has spread up to 700 miles south, mimicking its poleward spread in North America. Northern Ohio is also about 700 miles from the Limpkin’s core range in Florida. The southernmost record, found dead at Puerto Deseado, Argentina, is at 47.8 degrees south latitude. The northernmost record, just north of Minneapolis, is at 45.2 north latitude. Like a true invasive species, one even crossed the Andes!

Limpkins are not the only waterbird associated with Southeast wetlands that are expanding north. Birders have noticed northward range expansions among the following:

  • White Ibis
  • Neotropic Cormorant
  • Black-bellied Whistling Duck
  • Purple Gallinule
  • Anhinga
  • Roseate Spoonbill
  • and even Snail Kite, Swallow-tailed Kite, and Mississippi Kite
Limpkin

Many of these are actually declining in Florida (or Louisiana) as they increase in the north.

Indigenous Americans relied on observations of nature to provide information about weather, or when certain plants could be planted or harvested, or when certain fish or game were available. An Anhinga in New York, a Purple Gallinule in Ohio, White Ibises nesting in New Jersey, all of which have happened in this year – would be portents of change – or doom.

Miners kept canaries in coal mines to monitor the atmosphere. A sick or dead canary meant dangerous conditions in the mine. But imagine their surprise if their mine was suddenly invaded by a hundred canaries. That would mean something was amiss outside. Limpkins are becoming those canaries.

BREAKING: One day after posting this, a first record for Ontario, Canada.

UPDATE IN JULY 2023: Limpkin has reached Pennsylvania.

Carolina Wren + Climate Change vs the Polar Vortex

Like so many species, the Carolina Wren is expanding northward. And, like many of those species, this expansion started decades ago, before any measurable climate change, but has exploded in the past decades with climate change.

This phenomenon is most obvious – and even dramatic – among non-migratory species and short-distance migrants. The same thing is happening in the West (e.g. Anna’s Hummingbird, Turkey Vulture, Red-shouldered Hawk, Great Egret, California Scrub-Jay, Black Phoebe, Townsend’s Warbler, and others).

The Carolina Wren has been expanding north since the 1800s due to habitat recovery after deforestation (Haggerty and Morton, 2020 – the Birds of North America (BNA) species account). What makes the recent Carolina Wren data so interesting is that we can clearly see, in its expansion into Canada, its battle with winter weather conditions.

The raw number of Carolina Wrens reported on Christmas Bird Counts in Canada. Over 95% of these come from southern Ontario. The cold waves marked on the graph were particularly record-breaking and long-lasting.

The species is known for “decimation… by severe winter conditions” (BNA) at the northern limits of its range. The same account notes that “severe winters have apparently been infrequent enough during the 20th century to allow populations to expand and move northward.” Indeed, one of the key conclusions of an analysis of climate change in southern Ontario was that there has been “a decrease in the frequency of cold temperature extremes”.  While the wren is aided against cold snaps by bird feeders, the climate trend, at least in Canada, is in its favor. The report noted an overall average increase of 1.5C.

eBird abundance map. The Carolina Wren has primarily been a species of edge habitat associated with moist southern forests.

As the wren expanded, certain record-breaking and persistent cold waves knocked the population back, where it restarted. It’s also clear that it is restarting from a higher position each time, thus building its numbers and continuing its expansion.

The cold snaps denoted on the graph were particularly severe in southern Ontario. A more detailed look at weather data may reveal a more complicated pattern and even greater correlation to warmer winters.

Predicted range changes for Carolina Wren by National Audubon under 1.5C scenario. This map is fairly accurate as the bird continues to colonize the St. Lawrence River corridor.
eBird map for December 2021 showing colonization from Toronto to Ottawa and Montreal and nearly to Quebec City.
A Carolina Wren fluffed up against the cold. Pic from National Audubon website.

Mapping the expansion of the California Scrub-Jay into the Pacific Northwest

This blog post is merely to provide a visual illustration, by way of a map, of the expansion of the California Scrub-Jay across Washington, British Columbia, eastern Oregon, Idaho, and even Montana (one record so far). It is intended to complement my more detailed article, “Tracking Expansion of the California Scrub-Jay Into the Pacific Northwest”, in the Washington Ornithological Society (WOS) News, August-September 2021 edition.

California Scrub-Jays are often first detected at bird feeders in suburban areas. As aggressive nest predators, jays should not be subsidized by anthropogenic food sources. In short, please don’t feed the corvids. Port Townsend, WA. April 2021.

As becomes clear in the article, these are not hard lines. The jays are advancing gradually, not in a solid wave. Typically, a single jay will appear well outside the known range (e.g. Spokane). Within a year or two, there will be several. Then they’ll be breeding. Then they will begin expanding further. Meanwhile, a wave of jays will be backfilling the new territory, with densities increasing annually. The lines in this map are as much art as science, but are intended to show the primary region were jays were “regular and expected”. There were always outliers, pioneer dispersers expanding the range. Records beyond the 2020 line are shown as pale blue dots.

CLICK MAP TO ENLARGE

The expansion of the California Scrub-Jay mimics that of several other species, mostly non-migratory or short-distance migrants, rapidly expanding from California and Oregon into the Pacific Northwest.

The jay’s expansion has already surpassed that predicted by the Audubon Society’s climate model under a 3.0 degree Celsius scenario, shown here.

The jay’s expansion, when considered in the context of timing and trends in other species, is likely a function of a warming climate combined with suitable food sources. For more discussion of this, see the WOS article linked above.

They seem to be particularly taking advantage of warmer winters in the lower Columbia River Basin.

It will be interesting to see where the 2030 scrub-jay “contour line” will be. I predict they’ll be on Vancouver Island from Victoria to Campbell River, as well as up the Sunshine Coast, up the Okanagan Valley to Kelowna and possibly Kamloops, and east to Idaho, from Coeur d’Alene in the north throughout the Snake River Valley in the south.

After that, they face some formidable hurdles. The biggest obstacles to their expansion further north and east will be habitat with limited food sources (e.g. high mountains). That said, they’ve already shown some ability to travel up mountain valleys and potentially cross the Cascades north of Mount Rainier.

Like most corvids, California Scrub-Jays are big time cachers, storing extra food for future use. I took this photo in southern California, October 2017, when a family of jays were repeatedly stripping an oak, two acorns at a time, flying over a nearby ridge to cache them, and then returning again and again throughout the morning.

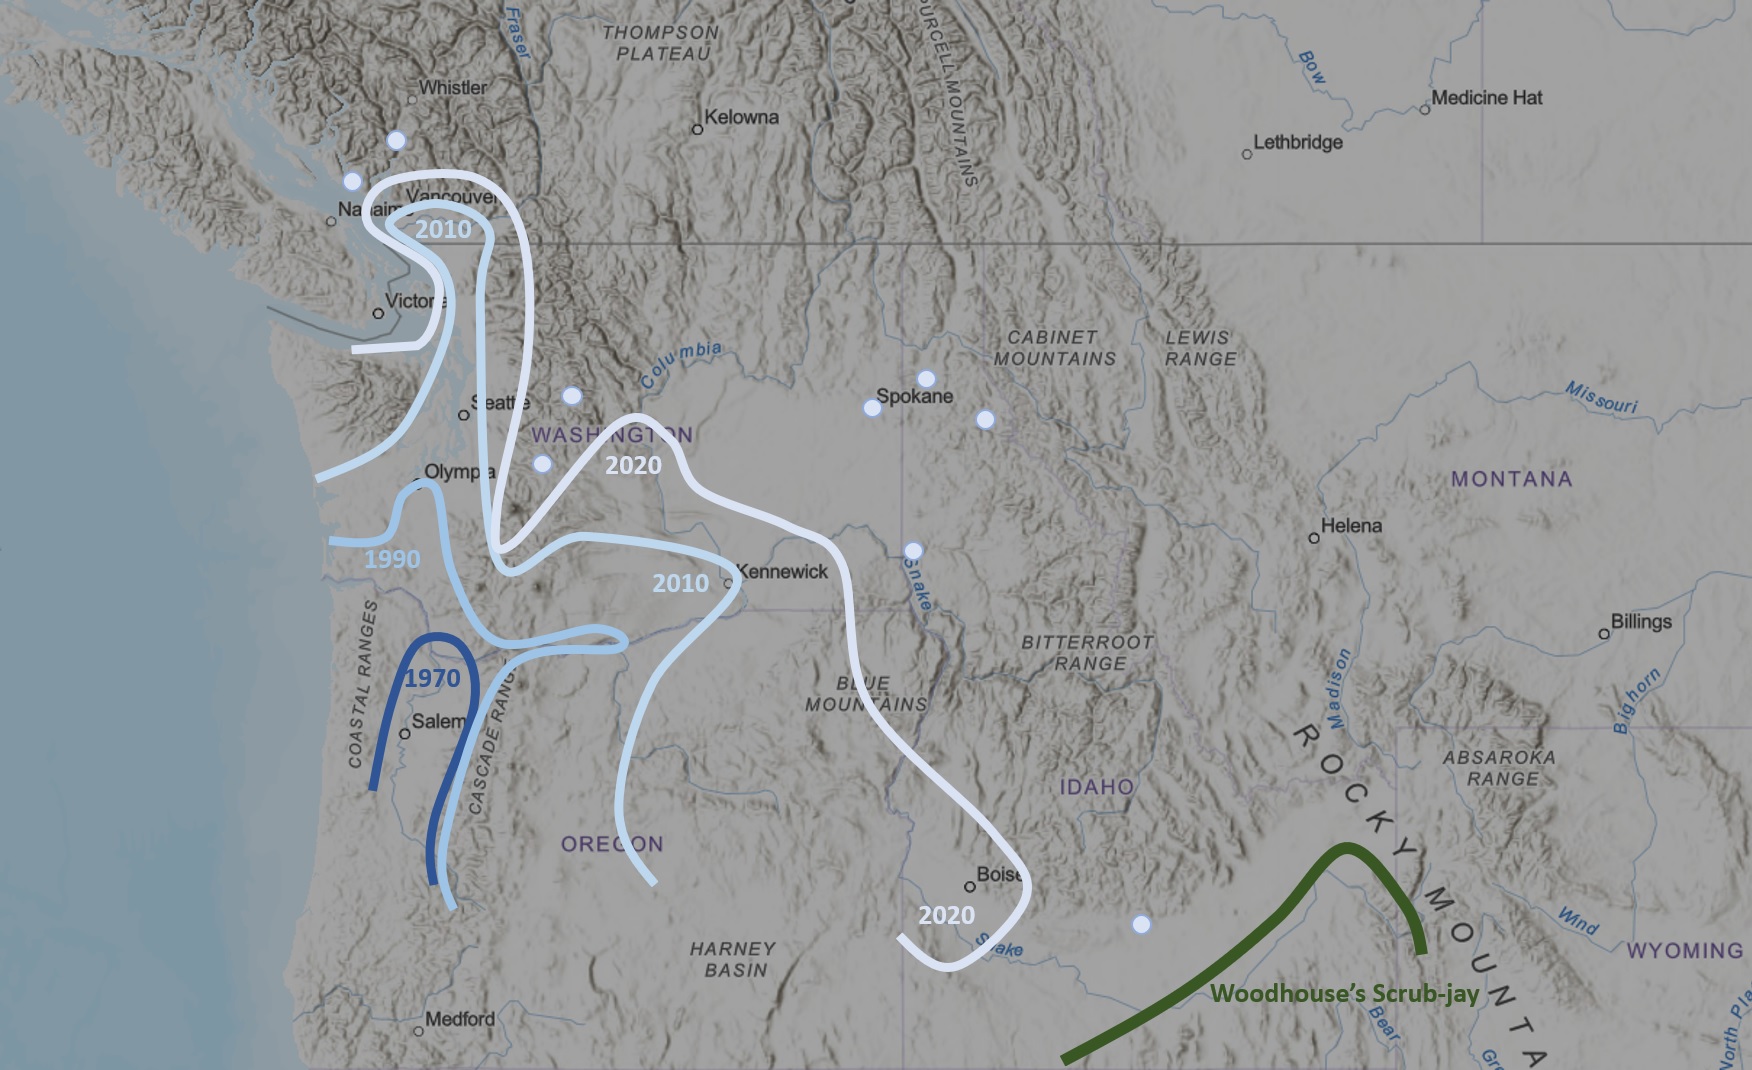
The invasion of the Pacific Northwest: California’s birds expand north with warmer winters

Birds, because of their mobility, are considered to be fairly adaptable to climate change. They evolved in the aftermath of two of the world’s most catastrophic warming events (the K-T extinction and the Paleocene-Eocene Thermal Maximum), spreading to the Arctic, crossing continents, and evolving along the way. While those warming events took place over tens of thousands of years, the current warming is happening in the space of a couple hundred, with noticeable changes in climate within the lifespan of a single bird.

There will be winners and losers. Generalists, and species that enjoy warmer weather, are likely to be winners. Those with narrow food or habitat requirements, especially those dependent on the ocean or the Arctic/Antarctic, will likely be losers. Although counter-intuitive, it is primarily non-migratory resident species that seem to be more adaptable to a changing climate.

Recent studies

Studies of climate impacts on western North American birds using past data are limited, but some focusing on California were recently published. Iknayan and Beissinger (2018) showed that, over the last 50 years, “bird communities in the Mojave Desert have collapsed to a new, lower baseline” due to climate change, with significant declines in 39 species. Only Common Raven has increased. Furnas (2020) examined data from northern California’s mountains, showing that some species have shifted their breeding areas upslope in recent years. Hampton (myself) (2020) showed increases in many insectivores, both residents and migrants (from House Wrens to Western Tanagers), in winter in part of the Sacramento Valley over the last 45 years. These changes, particularly range shifting north and out of Southwest deserts, is predicted for a wide number of species.

The invasion of the Pacific Northwest

Here I use Christmas Bird Count (CBC) data to illustrate that some of California’s most common resident birds have expanded their ranges hundreds of miles north into Oregon, Washington, and British Columbia in recent years. The increases are dramatic, highly correlated with each other across a wide range of species, and coincide with rapid climate change. They illustrate the ability of some species to respond in real time.

In parts of Oregon and Washington, it is now not unusual to encounter Great Egret, Turkey Vulture, Red-shouldered Hawk, Anna’s Hummingbird, Black Phoebe, and California Scrub-Jay on a single morning—in winter. A few decades ago, this would have been unimaginable. Some short-distance migrants, such as Townsend’s Warbler, are also spending the winter in the Pacific Northwest in larger numbers.

The following graphs, showing the total number of individuals of each species seen on all CBCs in Oregon, Washington, British Columbia, and (in one case) Alaska, illustrate the range expansions. Adjusting for party hours scarcely changes the graphs; thus, actual numbers of individuals are shown to better illustrate the degree of change. The graphs are accompanied by maps showing predicted range expansions by the National Audubon Society, and recent winter observations (Dec-Feb) from eBird for 2015-2020.

These range expansions were predicted, though in some cases the recent trends exceed even projected scenarios under 3.0C increases in temperature.

Let’s begin with the climate. Canada as a whole has experienced 3.0C in temperature increases in winter. British Columbia has experienced an average of 3.7C increase in Dec-Feb temperatures since 1948. The greatest increases have been in the far north; increases in southern British Columbia, Washington and Oregon have been closer to 1.5C.

winter temps in Canada.jpg

Average nationwide winter temperatures deviation from average.

Great Egret

Great Egrets on Oregon CBCs have increased from near zero to nearly 900 on the 119th count (December 2018 – January 2019).

CLICK ON GRAPHS TO ENLARGE

GREG OR graph.jpg

But their expansion, which took off in the early 1990s into Oregon, is now continuing in Washington, with a significant rise beginning in the mid-2000s. Great Egrets occur regularly in southern British Columbia, but so far have eluded all CBCs.

GREG WA graph.jpg

They have not quite fulfilled the full range predicted for a 1.5C increase, but are quickly on their way there.

GREG maps.jpg

Turkey Vulture

Turkey Vultures began increasing dramatically in winter in the Sacramento Valley of California in the mid-1980s, correlated with warmer winters and a decrease in fog. Prior to that, they were absent. Now, over 300 are counted on some CBCs. That pattern has been repeated in the Pacific Northwest, though about 20 years later. Both Oregon and British Columbia can now expect 100 Turkey Vultures on their CBCs. Curiously, Puget Sound is apparently still too cloudy for them, who prefer clear skies for soaring, though small numbers are regular in winter on the Columbia Plateau.

TUVU CBC graph.jpg

TUVU maps.jpg

Red-shouldered Hawk

Red-shouldered Hawks have increased from zero to over 250 inviduals on Oregon CBCs, taking off in the mid-1990s.

RSHA OR graph.jpgTwenty years later, they began their surge into Washington. It’s a matter of time before the first one is recorded on a British Columbia CBC.

RSHA WA graph.jpg

While their expansion in western Washington is less than predicted, their expansion on the east slope, in both Oregon and Washington, is greater than predicted. This latter unanticipated expansion into the drier, colder regions of the Columbia Plateau is occurring with several species.

RSHA maps.jpg

Anna’s Hummingbird

If this invasion has a poster child, it’s the Anna’s Hummingbird, which, in the last 20 years, have become a common feature of the winter birdlife of the Pacific Northwest. Their numbers are still increasing. While much has been written about their affiliation to human habitation with hummingbird feeders and flowering ornamentals, the timing of their expansion is consistent with climate change and shows no sign of abating. Anna’s Hummingbirds are not expanding similarly in the southern portions of their range. The sudden rate of expansion, which is evidenced in most of the species shown here, exceeds the temperature increases, suggesting thresholds are being crossed and new opportunities rapidly filled.

ANHU CBC graph.jpg

The expansion of the Anna’s Hummingbird has now reached Alaska, where they can be found reliably in winter in ever-increasing numbers.

ANHU AK graph.jpg

The range expansion of the Anna’s Hummingbird has vastly outpaced even predictions under 3.0C. In addition to extensive inland spread into central Oregon and eastern Washington, they now occur across the Gulf of Alaska to Kodiak Island in winter.

ANHU maps.jpg

Black Phoebe 

Non-migratory insectivores seem to be among the most prevalent species pushing north with warmer winters. The Black Phoebe fits that description perfectly. Oregon has seen an increase from zero to over 500 individuals on their CBCs.

BLPH OR graph.jpg

With the same 20-year lag of the Red-shouldered Hawk, the Black Phoebe began its invasion of Washington.

BLPH WA graph.jpg

The figure below illustrates two different climate change predictions, using 1.5C and 3.0C warming scenarios. While nearly a third of the Pacific Northwest’s Black Phoebes are in a few locations in southwest Oregon, they are increasingly populating the areas predicted under the 3.0C scenario.

BLPH maps.jpg

Townsend’s Warbler

Migrant species tend not to show the dramatic range expansions of more resident species – and short-distance migrants show more range changes than do long-distance migrants. Townsend’s Warblers, which winter in large numbers in southern Mexico and Central America, also winter along the California coast. Increasingly, they are over-wintering in Oregon and, to a lesser degree, Washington. This mirrors evidence from northern California, where House Wren, Cassin’s Vireo, and Western Tanager are over-wintering in increasing numbers. These may be next for Oregon.

TOWA WA OR graph.jpg

Townsend’s Warblers are already filling much of the map under the 1.5C warming scenario, though their numbers on CBCs in Washington and British Columbia have yet to take off.

TOWA maps.jpg

California Scrub-Jay

Due to problems with CBC data-availability, I have no graph for the California Scrub-Jay. Their northward expansion is similar to many of the species above. Their numbers on Washington CBCs have increased from less than 100 in 1998 to 1,125 on the 2018-19 count. eBird data shows they have filled the range predicted under the 3.0C scenario and then some, expanding into eastern Oregon, the Columbia Plateau, and even Idaho.

CASJ maps.jpg

Other species

Other species which can be expected to follow these trends include Northern Mockingbird and Lesser Goldfinch. (See more on the expansion of the Lesser Goldfinch here.) White-tailed Kite showed a marked increased in the mid-1990s before retracting, which seems to be part of a range-wide decline in the past two decades, perhaps related to other factors.

Curiously, three of the Northwest’s most common resident insectivores, Hutton’s Vireo, Bushtit, and Bewick’s Wren, already established in much of the range shown on the maps above, show little sign of northward expansion or increase within these ranges. The wren is moving up the Okanogan River, and the vireo just began making forays onto the Columbia Plateau. Both of these expansions are predicted.

Likewise, some of California’s oak-dependent species, which would otherwise meet the criteria of resident insectivores (e.g. Oak Titmouse), show little sign of expansion. Oaks are slow-growing trees, which probably limits their ability to move north quickly. Similarly, the Wrentit remains constrained by a barrier it cannot cross—the Columbia River.

Call it the invasion of the Northwest. Call it Californication. Call it climate change or global warming. Regardless, the birds of California are moving north, as predicted and, in some cases, more dramatically than predicted.

ANHU CBC graph.jpg