The Coming Green Wave

This op-ed in the New York Times boldly declares:

“if just one unorganized voting segment, the 60 million bird-watchers of America, sent a unified political message this fall, you’d have a political block with more than 10 times the membership of the National Rifle Association.”

There are other fun stats, like there are more yoga instructors in the US than there are coal miners. Enjoy. And vote.


Fall Migration in the Central Valley

warblers fall 2018In 2010, after ten years of collecting data on morning “warbler walks” in my local patch, the Central Valley Bird Club Bulletin published my results. You can read the whole paper here:

Hampton, S. 2010. Passerine migration patterns in Davis, Yolo County—2000-2010. Central Valley Bird Club Bulletin 13(3): 45-61.

Mac

Bay Area birders are surprised when I tell them Willow Flycatchers and MacGillivray’s Warblers (above) are daily in fall migration in Davis.

It begins with this:
“Although passerine migration may conjure images of Point Reyes for many local birders, the Central Valley, with its north-south orientation, is believed to be the primary migration corridor through California for most species, surpassing the coastline in this regard (Humple and Geupel 2002).”


Here, I’ve re-visualized my results for fall migration in two simple graphs, one for more common species (peaking at 2 to 13 birds per survey), and another for less common migrants (around 1 or less per survey).

CLICK TO ENLARGE.

DavisMigrants1

DavisMigrants2

A few caveats:

  • A “survey” here is basically a morning walk lasting about 35 minutes.
    This was for my little route in north Davis. For other locations in the Central Valley, even nearby ones, I would expect the numbers and relative abundance to vary a little. For example, I see a lot more flycatchers at Babel Slough and Grasslands Park than are reflected here.
  • Putah Creek near Pedrick Rd, a current favorite of birders, generally has more birds than is shown here because it’s a larger area, birders spend more than 35 minutes when they visit, and the habitat is slightly different. It seems better at holding fall migrants for more days, making their detection more likely.
  • On these new graphs, I’ve left out the rarer birds, species that occur at a rate of less than 0.2 birds/survey (less than 1 out of every 5 surveys).
  • A large portion of the birds in my data are “heard only”.
  • For spring migration and additional details, see the full article linked above.

This last graph provides a cumulative view of all the migrants at once. Peak diversity is in late August. After that, the Yellow Warblers take over. After that, not shown here, the Yellow-rumped Warblers, both Audubon’s and Myrtle, arrive, signalling the end of fall migration.

DavisMigrants3

It would be interesting to compare these relative abundances and timing with more recent eBird data, both in north Davis (where the eBird hotspot for this survey area is “North Davis Farms Subdivision”) as well as other locations in the Central Valley. Have at it. I’m happy to provide my Excel spreadsheets of this data to anyone interested.


California apocalypse again: Large wildfires increasing with climate change

smoke

Sunset from the Central Valley, looking toward the Coast Range through the smoke of a million trees.

As I write this, helicopters are passing overhead in a dim gray-brown sky. The sun is a pink orb over the western horizon. It is 97 degrees at 7pm. The people of California sit like frogs in a slowly boiling pot.

Average temperature for July and August, here in Davis, is 93 degrees. But in the past 34 days, it was only below that six times. July 2018 was the hottest month in the history of the state.

Such climate change was predicted, with great accuracy, by both oil companies and government scientists back in the 1980s, and even earlier.  The consequences of this included more extreme weather, more drought, shorter rainy seasons, earlier snow melt, longer fire seasons, and larger fires. All that is coming to pass in such dramatic fashion that new records are set each year.

[CLICK TO ENLARGE GRAPHS]

Note: There were more mega-fires in November, 2018, shortly after I wrote this. These graphs are updated in a more recent blog post “Hell in Paradise: Why the Camp Fire was the largest climate-induced mass mortality event in modern history”

CA fires1In 1988, scientists were excited– and alarmed– to see the first indications of a warming climate. Now, graphs illustrating climate change need no statistical analysis. They are obvious to a child, ramping steeply up with each passing year.

CA fires2

A conservative talking point seems to be that this dramatic increase in fires is not due to climate change, but to poor forest management. While this has been an issue for over a hundred years, this question was the prime focus of Westerling et al 2006 in Science, where he concluded that longer hotter summers and shorter drier winters were indeed to blame. There were increased fires even in areas without poor management– or any management at all. Where there has been poor forest management, climate warming has acted as a “force multiplier” to make fires even worse. One could only imagine how easy it would be to write that paper now, twelve years later, with plenty of new eye-popping data points.  Thirteen of California’s 20 largest fires have occurred since Westerling sent his paper to the publisher.

Perhaps the best illustration of the combined effect of poor forest management and climate change comes from this 14-minute Ted talk given by Paul Hessburg in 2017.

Using a useful forest diagram, he explains how Native Americans regularly burned underbrush and maintained an open forest/meadow ecosystem that effectively prevented large wildfires. In the late 1800s, with the ethnic cleansing of Native Americans, the advent of cattle that ate the grass, and the US Forest Service suppressing fires and logging the largest trees, our forests changed from a mosaic of tough old trees surrounded by natural fire breaks to a solid crop of young growth. Add drought, heat, and an ignition source, and you see the results above.

CA fires3

The solution, regardless of how much you attribute large fires to climate change or management, is the same. We need to re-create the balance of the past thru the protection of large trees and prescribed burns. We need to create meadows and healthy forests. Some Native communities in northern California are planning to do this.

This all assumes that we get enough rain in winter and cool temps in summer to allow re-growth. Otherwise, the current fires may be transforming California’s mountain habitats into something resembling the mountains of Nevada and Arizona in the span of a decade.

Oil companies have researched climate change for 50 years– accurately

Long before climate change was controversial, before Al Gore’s Inconvenient Truth, before the public was even aware of greenhouse gases and sea level rise, the oil industry Oaklandtimelineknew pretty much what we now know today. They have been studying, researching, and modeling climate change as a result of their greenhouse gas emissions for over 50 years. Their research was in concert with the scientific community and decades ahead of public knowledge of the problem. Their predictions were typically exactly in line with the rest of the scientific world, and actually more aggressive than predictions by the United Nations’ Intergovernmental Panel on Climate Change (IPCC).

The evidence is all laid out in the First Amended Complaint by the City of Oakland and State of California in their climate change lawsuit against BP, Chevron, ConocoPhillips, ExxonMobil, and Shell.

The case was recently dismissed, but more like it are sure to come. The full complaint, which also includes a nice summary of climate change and its future impacts on the City of Oakland, is available at this webpage (scroll down to 04/03/2018 Complaint).

A recent piece in the New York Times Magazine lays out how the government knew all this too, back in the 1980s, when Republicans and the oil industry agreed it was a problem, but then did nothing.

Here I re-post from Oakland’s First Amended Complaint the section on Big Oil’s knowledge and research of climate change:

DEFENDANTS HAVE PRODUCED MASSIVE AMOUNTS OF FOSSIL FUELS DESPITE HAVING FULL KNOWLEDGE FROM THEIR IN-HOUSE SCIENTIFIC STAFF, OR FROM API, THAT FOSSIL FUELS WOULD CAUSE GLOBAL WARMING.

For decades, Defendants have known that their fossil fuel products pose risks of “severe” and even “catastrophic” impacts on the global climate through the work and warnings of their own scientists and/or through their trade association, the American Petroleum Institute (“API”). Defendants, large and sophisticated companies devoted to researching significant issues relevant to fossil fuels, also were aware of significant scientific reports on climate change science and impacts at the time they were issued. Yet each Defendant decided to continue its conduct and commit itself to massive fossil fuel production. This was a deliberate decision to place company profits ahead of human safety and well-being and property, and to foist onto the public the costs of abating and adapting to the public nuisance of global warming.

The API is a national trade association that represents the interests of America’s oil and natural gas industry. At all relevant times, Defendants, their corporate predecessors and/or their operating subsidiaries over which they exercise substantial control, have been members of the API. On information and belief, the API has acted as Defendants’ agent with respect to global warming, received funding from Defendants for the API’s global warming initiatives, and shared with Defendants the information on global warming described herein.

Beginning in the 1950s, the API repeatedly warned its members that fossil fuels posed a grave threat to the global climate. These warnings have included, for example, an admission in 1968 in an API report predicting that carbon dioxide emissions were “almost certain” to produce “significant” temperature increases by 2000, and that these emissions were almost certainly attributable to fossil fuels. The report warned of “major changes in the earth’s environment” and a “rise in sea levels,” and concluded: “there seems to be no doubt that the potential damage to our environment could be severe.” Similar warnings followed in the ensuing decades, including reports commissioned by the API in the 1980s that there was “scientific consensus” that catastrophic climate change would ensue unless API members changed their business models, and predictions that sea levels would rise considerably, with grave consequences, if atmospheric concentrations of CO2 continued to increase.

The API’s warnings to Defendants included:

  • a) In 1951, the API launched a project to research air pollution from petroleum products, and attributed atmospheric carbon to fossil fuel sources. By 1968, the API’s scientific consultant reported to the API that carbon dioxide emissions were “almost certain” to produce “significant” temperature increases by 2000, and that these emissions were almost certainly attributable to fossil fuels. The report warned of “major changes in the earth’s environment” and a “rise in sea levels,” and concluded: “there seems to be no doubt that the potential damage to our environment could be severe.”
  • b) Between 1979 and 1983, the API and Defendants, their predecessors, and/or agents formed a task force to monitor and share climate research, initially called the “CO2 and Climate Task Force” and later renamed the “Climate and Energy Task Force” (“Task Force”). The API kept and distributed meeting minutes to Task Force members. Task Force members included, in addition to API representatives, scientists from Amoco (a predecessor to BP); Standard Oil of California, Texaco, and Gulf Oil Corp. (predecessors to Chevron); Exxon Research and Engineering and Mobil (predecessors to or subsidiaries of current Exxon); Shell; and others. In 1980, the Task Force invited Dr. J.A. Laurman, a “recognized expert in the field of CO2 and climate,” to make a presentation. Attendees to the presentation included scientists and executives from Texaco (a predecessor to Chevron), Exxon, and SOHIO (a predecessor to BP). Dr. Laurman’s written presentation informed the Task Force that there was a “Scientific Consensus on the Potential for Large Future Climatic Response to Increased CO2 Levels.” He further informed the Task Force in his presentation that, though the exact temperature increases were difficult to predict, the “physical facts agree on the probability of large effects 50 years away.” He warned the Task Force of a 2.5 ºC [4.5 ºF] global temperature rise by 2038, which would likely have “MAJOR ECONOMIC CONSEQUENCES,” and a 5 ºC [9 ºF] rise by 2067, which would likely produce “GLOBALLY CATASTROPHIC EFFECTS.” He also suggested that, despite uncertainty, “THERE IS NO LEEWAY” in the time for acting. API minutes show that the Task Force discussed topics including “the technical implications of energy source changeover,” “ground rules for energy release of fuels and the cleanup of fuels as they relate to CO2 creation,” and researching “the Market Penetration Requirements of Introducing a New Energy Source into World Wide Use.” The Task Force even asked the question “what is the 50 year future of fossil fuels?”
  • (c) In March 1982, an API-commissioned report showed the average increase in global temperature from a doubling of atmospheric concentrations of CO2 and projected, based upon computer modeling, global warming of between 2 and 3.5 ºC [3.6 to 6.3 ºF]. The report projected potentially “serious consequences for man’s comfort and survival,” and noted that “the height of the sea level can increase considerably.”

On information and belief, Defendants were aware of the industry Task Force and API findings described above, which were distributed by the API to its members. Each Defendant (or its predecessor) was a member of the API at relevant times, or had a subsidiary that was a member of the API at relevant times. Each subsidiary passed on information it learned from the API on climate change to its parent Defendant (or Defendant’s predecessor) and acted as the agent for its parent company, which remained in charge of setting overall production levels in light of climate change and other factors.

On information and belief, each Defendant was also actually aware (at the time they were made) of public statements on climate change described above, including the 1979 National Academy of Science findings and Dr. Hansen’s 1988 testimony. Because these statements were centrally relevant to Defendants’ ongoing investment of billions of dollars in fossil fuel production and billions of dollars in profits, and because Defendants employed experts charged with evaluating climate change and other energy and regulatory trends, Defendants were in a superior position to appreciate the threat described in these statements. Defendants’ representatives attended congressional hearings on climate change beginning as early as the late 1970s.

In addition to the API information, some of the Defendants produced their own internal analyses of global warming. For example, newly disclosed documents demonstrate that Exxon internally acknowledged in the late 1970s and early 1980s that its products posed a “catastrophic” threat to the global climate, and that fossil fuel use would have to be strictly limited to avoid severe harm:

  • a) Exxon management was informed by its scientists in 1977 that there was an “overwhelming” consensus that fossil fuels were responsible for atmospheric carbon dioxide increases. The presentation summarized a warning from a recent international scientific conference that “IT IS PREMATURE TO LIMIT USE OF FOSSIL FUELS BUT THEY SHOULD NOT BE ENCOURAGED.” The scientist warned management in a summary of his talk: “Present thinking holds that man has a time window of five to ten years before the need for hard decisions regarding changes in energy strategies might become critical.”
  • b) In a 1979 Exxon internal memo, an Exxon scientist calculated that 80% of fossil fuel reserves would need to remain in the ground and unburned to avoid greater than a doubling of atmospheric carbon dioxide.
  • c) In a 1981 internal Exxon memo, a scientist and director at the Exxon Research and Engineering Company warned that “it is distinctly possible” that CO2 emissions “will later produce effects which will indeed be catastrophic (at least for a substantial fraction of the earth’s population).”
  • d) A year later, the same scientist wrote another memo to Exxon headquarters, which reported on a “clear scientific consensus” that “a doubling of atmospheric CO2 from its preindustrial revolution value would result in an average global temperature rise of (3.0 ± 1.5) ºC [2.7 ºF to 8.1 ºF].” The clear scientific consensus was based upon computer modeling, which Exxon would later attack as unreliable and uncertain in an effort to undermine public confidence in climate science. The memo continued: “There is unanimous agreement in the scientific community that a temperature increase of this magnitude would bring about significant changes in the earth’s climate, including rainfall distribution and alterations in the biosphere.”
  • e) In November 1982, an Exxon internal report to management warned that “substantial climatic changes” could occur if the average global temperature rose “at least 1ºC [1.8 ºF] above [1982] levels,” and that “[m]itigation of the ‘greenhouse effect’ would require major reductions in fossil fuel combustion.” The report then warns Exxon management that “there are some potentially catastrophic events that must be considered,” including the risk that “if the Antarctic ice sheet which is anchored on land should melt, then this could cause a rise in sea level on the order of 5 meters.” The report includes a graph demonstrating the expected future global warming from the “CO2 effect” demonstrating a sharp departure from the “[r]ange of natural fluctuations.” This graph is attached hereto as Exhibit 3.
  • oakland1
  • f) By 1983, Exxon had created its own climate models, which confirmed the main conclusions from the earlier memos. Starting by at least the mid-1980s, Exxon used its own climate models, and governmental ones to gauge the impact that climate change would have on its own business operations and subsequently took actions to protect its own business assets based upon these modeling results.

Exxon’s early research and understanding of the global warming impacts of its business was not unique among Defendants. For example, at least as far back as 1970, Defendants Shell and BP began funding scientific research in England to examine the possible future climate changes from greenhouse gas emissions. Shell produced a film on global warming in 1991, in which it admitted that there had been a “marked increase [in global temperatures] in the 1980s” and that the increase “does accord with computer models based on the known atmospheric processes and predicted buildup of greenhouse gases.” It acknowledged a “serious warning” that had been “endorsed by a uniquely broad consensus of scientists” in 1990. In the film, Shell further admits that by 2050 continued emissions of greenhouse gases at high levels would cause a global average temperature increase of 1.5 to 4º C (2.7 to 7.2º F); that one meter of sea level rise was likely in the next century; that “this could be disastrous;” and that there is a “possibility of change faster than at any time since the end of the ice age, change too fast, perhaps, for life to adapt without severe dislocation.”

The next section is entitled,

DESPITE THEIR EARLY KNOWLEDGE THAT GLOBAL WARMING WAS REAL AND POSED GRAVE THREATS, DEFENDANTS PROMOTED FOSSIL FUELS FOR PERVASIVE USE WHILE DOWNPLAYING THE REALITY AND RISKS OF GLOBAL WARMING.

The document also includes this graph:

oakland2

The graph compares the greenhouse gas emissions trajectory necessary to prevent global warming from exceeding a 2º C increase over the pre-industrial temperature (IEA 450 from International Energy Agency) to BP, Exxon and Shell’s projections of total worldwide future emissions that they use to make long-term business plans.

Wikipedia provides a nice history of climate change research. Global warming as a result of CO2 emissions was first described in 1896. The theory attracted more attention in the 1950s. The term “greenhouse” was used in a government report in 1965. However, it was not until the mid-1970s that a scientific consensus began to emerge on the level of global warming associated with CO2 emissions. The oil companies not only followed it closely, but developed their own models that corroborated the science. The dangers of global warming did not attract public attention until 1988, long after Big Oil had thoroughly studied it and knew of its impacts.

Birders detect dramatic changes as Davis climate warms

[A version of this was originally published in the Davis Enterprise.]

In 2002, the cover of The New York Times Magazine featured a silhouetted man standing on frosty mauve ice and staring through binoculars into a rosy polar sky. The title read, davis1“Watching the World Melt Away: The future as seen by a lonely scientist at the end of the earth.” The article was about seabird biologist George Divoky and his decades of work studying the black guillemot, a high arctic seabird, on Cooper Island off the coast of Barrow, Alaska. The guillemots were struggling to feed their chicks. Their preferred food, Arctic cod, lived at the edge of the sea ice. In the past, this was five miles from the island. Now it was thirty. Divoky, moreover, found himself sharing his tiny island with several hungry polar bears stranded by the vast expanse of open water. At the time, the story was one of the first concrete examples of climate change impacting an ecosystem in way that was easily seen and understood.

Sac Valley winter avg temps SH

Sixteen years later, birders in Yolo County are now witnessing those kinds of changes at our latitude. Winters are suddenly filled with species previously associated with warmer climates to the south, while some other winter visitors no longer come this far south. In the summer, new species are arriving from more arid regions and have started nesting locally.

0V2A9850

Orchard Oriole in Davis, December 2017

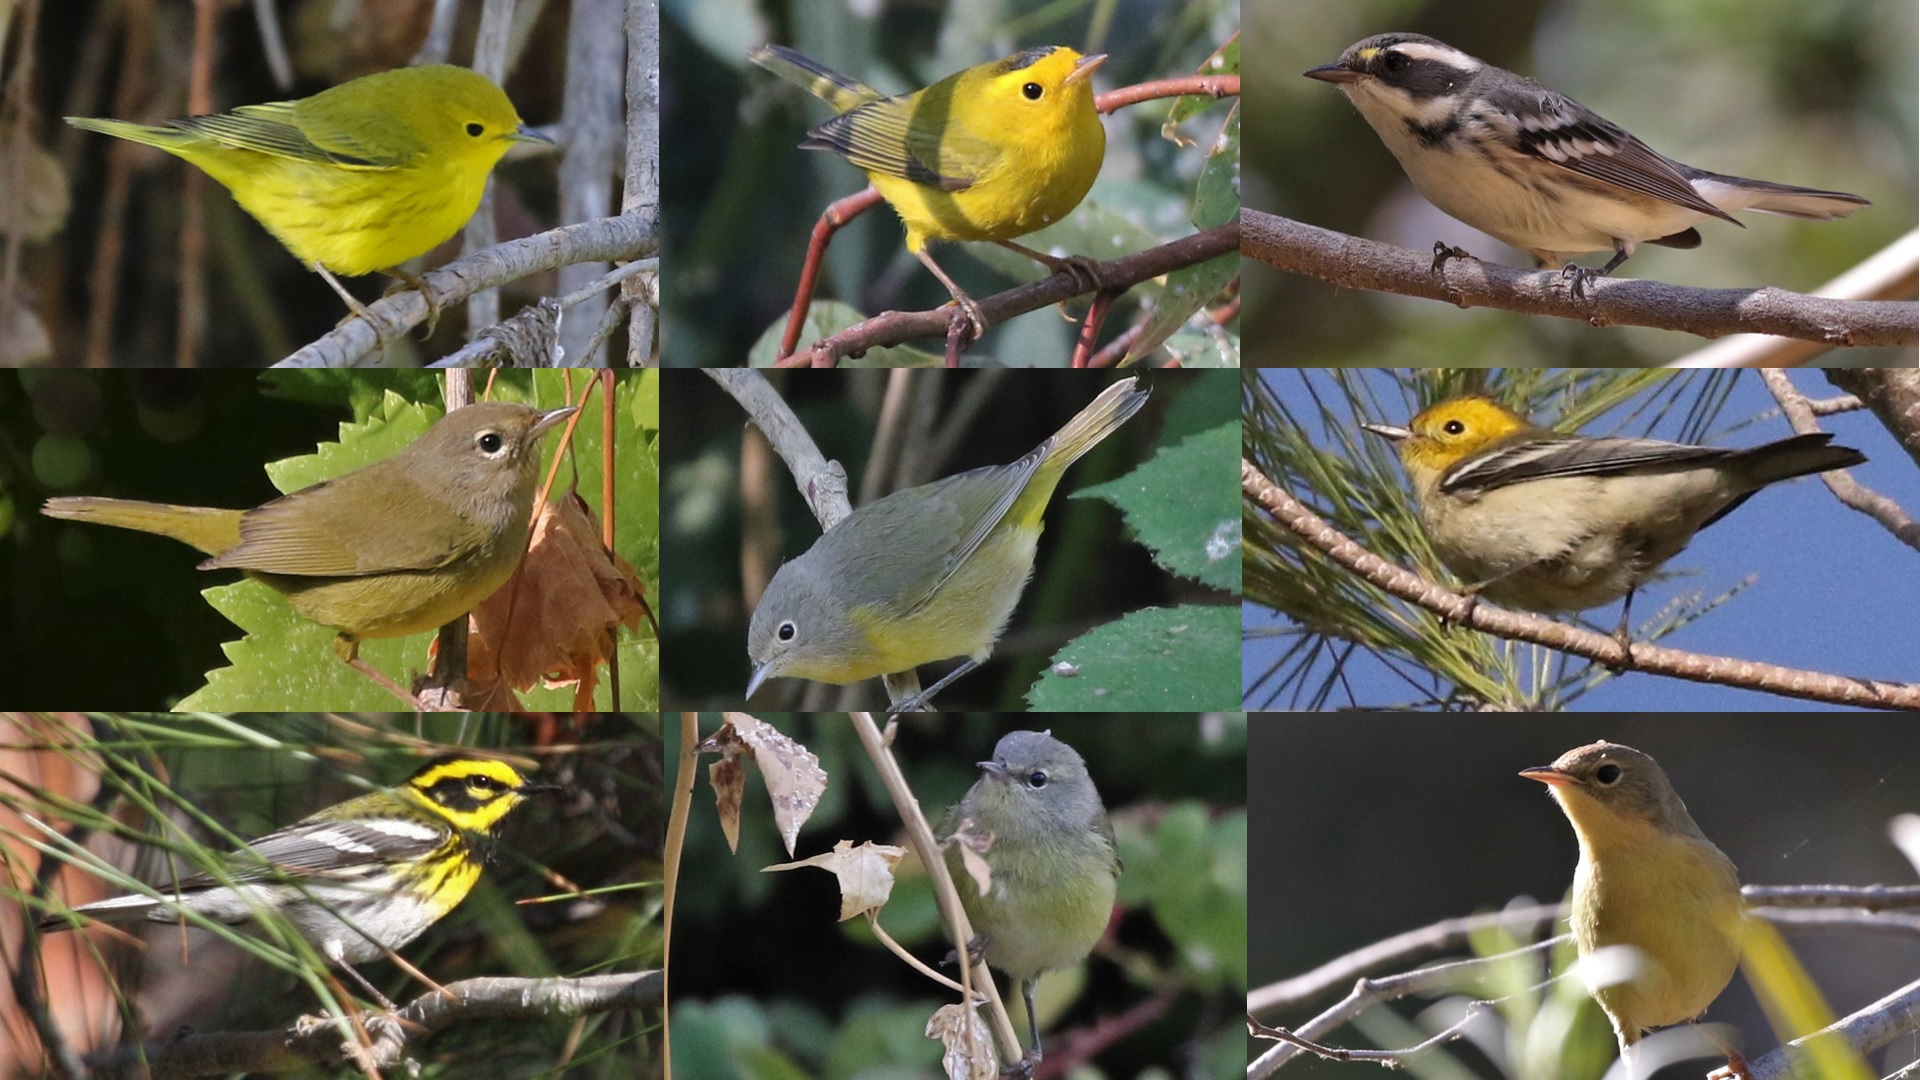
A shift of a few degrees may not seem like much, but a winter above freezing makes autumn fruit and berries available longer, resulting in a plentiful food supply. This past December, birders were astounded to find eight species of warblers and three species of orioles in the county at once. Normal would be three and zero, respectively. These birds are neotropical migrants, spending the summer nesting in the northern United States and Canada, and wintering in Southern California, Mexico, or Central and South America. In the last few years, Cassin’s vireos, black-throated gray warblers, and blue-gray gnatcatchers have been present at many locations throughout the cold months. It is now possible to find hooded orioles and western tanagers year-round. Last winter, rarities like orchard oriole, northern waterthrush, and palm warbler turned up and stayed for weeks or months. The prevalence of unusual over-wintering migrants has enabled birders to rack up quite a winter list. Holly Coates shattered previous “big year” records by tallying 200 species in Yolo County by March 20 this year.

neotrop migrants graph
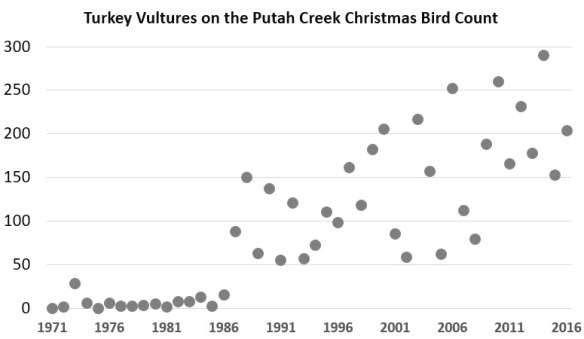
The Putah Creek Christmas Bird Count, an annual effort to count all the birds in a 15-mile diameter circle near Winters on one day each December, has tracked winter bird populations since 1971. In recent years, the number of neotropical migrants found on the count has swelled. These include warbling vireo and Wilson’s and Townsend’s warblers, in addition to the species mentioned above. Perhaps the most dramatic shift in the count data has been with the turkey vulture. With the absence of tule fog, these birds, which rely on warm thermals to give them some lift, have gone from sparse, rarely more than 15 birds on a count through 1985, to over 150 individuals per count in each of the past eight years.

turkey vulture graphA warming climate is expected to create more increases than decreases in bird life in Yolo County. This is because species diversity is greatest in the tropics. As bird ranges shift north, we expect to see more arrivals than departures. Among the departures are some northern species that are growing scarcer in winter. Most notable is rough-legged hawk, a tundra species that journey south to agricultural areas to eat rodents in winter. They have, however, become decidedly hard to find in recent years, perhaps finding the Willamette Valley and other more northern valleys suitable for their wintering grounds. Another species to watch is the beautiful cedar waxwing, which descend on fruits and berries in the winter months. The more they can find food in the north, the less likely they will come this far south.  They are erratic from year to year, however, so it is too early to identify a trend.

Though less dramatic, our hotter summers have brought some changes as well. Great-tailed grackles have expanded up the Central Valley from the Salton Sea. Say’s phoebes, which previously nested only south of the Delta in the Central Valley, moved into Napa and Solano Counties in 2014. Perhaps they are focusing on certain species of insects. This spring, Michael Perrone found them nesting in Davis and Joan Humphrey discovered them feeding young in Woodland, representing first nesting records for the county.

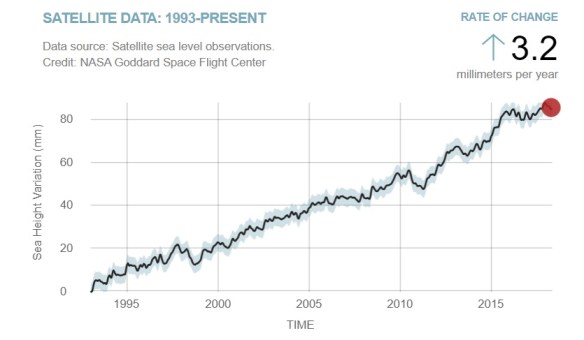
The Yolo Audubon Society is currently revising its Checklist of the Birds of Yolo County, a useful little booklet that will list all 369 species recorded in the county, each with a bar chart showing their abundance through the year. The last version, published in 2004, had a special section called “Recent Changes” highlighting the wetland restoration projects at the Yolo Bypass Wildlife Area and Davis Wetlands. In the coming 2018 version, the Recent Changes section will focus on two big issues: the expansion of orchards and our changing climate. Perrone, author of that section, states that “winters have become milder. In particular, prolonged periods of cold, all-day tule fog have ceased, giving way to sunnier weather.” Davis birders may not be standing on the edge of the continent looking at retreating sea ice, but nevertheless, in the last few years they have witnessed dramatic changes in bird distributions. A look at the graphs, moreover, suggests these changes began before that article about Alaska was published.

Faster all the time: The basics of sea level rise

I was lucky to be out of town for a week during “the greatest statewide heat wave ever recorded in California.” When I arrived in Seattle, I was quickly informed that they had just set a record of 55 consecutive days without rain—and that the record would still be increasing had it not been for 0.02 inches late one night a few weeks earlier. Seattle has also set a number of heat records the past four summers. The same people that bragged about this “beautiful weather” scoffed that I believed in climate change. They asserted that no sea level rise would occur during our, our children’s, or our grandchildren’s lifetimes because, 1) Puget Sound was not really part of the ocean; and 2) those NOAA flood maps are “bureaucratic bullshit”.  These same people live on the water in homes that are a few feet above current maximum high tides. Days later we all swept ashes off decks while marveling at the sun, which was reduced to a rosy red disc by smoke from a record 68 large uncontained fires burning across the West.

Astounded by the number of homes, roads, and railroad tracks located just toe-dipping distance above Puget Sound, I set out to learn about sea level rise, talking to experts and reading published studies and reports from the Intergovernmental Panel on Climate Change (IPCC) .  Here are the basics.

  • Increases in sea level lag quite a bit behind climate change. We set the record for the warmest year on earth in 2016, breaking the record from 2015, which broke the record from 2014. For something as variable as weather, which has all kinds of ups and downs, this kind of consecutive record-breaking suggests runaway global warming. It is dramatic. But not so with sea levels.
  • Sea level rise is a function of several different factors:
    1. Thermal expansion: This happens because, like air or most anything else, water expands when it is warmer, taking up more space. As ocean temperatures increase, they bulge up a bit, and the sea level rises. This can be quantified with pretty good precision and is already occurring. In fact, this explains nearly all of the sea level rise currently underway.
    2. Antarctic Ice Sheet: While melting ice in the Arctic Ocean affects weather and ocean currents, it doesn’t add to the sea level because the ice was already in the ocean to begin with. An ice cube that melts in a glass of water does not change the water level. But glaciers that are on land, like in Antarctica, will flow into the sea when they melt, thus adding to sea levels. They are like an ice cube perched on the edge of the glass, melting into it.
    3. Greenland Ice Cap: While not as big as the Antarctic Ice Sheet, the Greenland Ice Cap will melt faster. In fact, it is already becoming the next big contributor to sea level rise.
    4. Other glaciers and other factors: Smaller glaciers from Alaska to New Zealand are melting, and also adding to sea level.
  • Sea level rise is underway, currently at a rate of 3.2 mm/yr (about a foot per 100 years). It has already risen 2 ½ inches since the year 2000, and 6 ½ inches since 1900.
  • The rate of sea level rise is increasing as ice melt from Greenland, Antarctica, and other glaciers begin to contribute. The standard practice is to estimate total sea level rise by the year 2100 as compared to 2000. Because the rate is increasing, it will certainly be more than the one foot described above, because ice melt from Greenland, Antarctica, and other places is just beginning. However, estimating that increase is difficult. The 2013 report from the IPCC estimated total sea level rise by 2100 at 1 foot to 3.2 feet, depending upon assumptions about CO2 levels. Because Greenland and other Arctic glaciers are melting faster than anticipated, the IPCC report has come under criticism from scientists, who have now adjusted their estimates up to 1.7 feet to possibly 6 feet by 2100. (Revision from November 2017:  A new study estimates sea level rise at 6 to 11 feet by 2100.)
sealevel3

The projected range of sea level rise, depicted in scale over a waterfront home.

  • The rate of sea level rise will continue to increase at an increasing rate for several hundred years. The Antarctic Ice Sheet and Greenland have a lot of ice, and melting takes time. This melting, which is only just beginning, will increase with time, but may still take hundreds of years to really pick up steam. This appears to be “virtually certain”. The Antarctic Ice Sheet is now considered to be “past the point of no return”, with large scale melting “unstoppable.” Still, the exact timing is unknown. It will begin slowly but then suddenly increase rapidly, possibly during this century. This caveat is included in all predictions. The “conservative” estimate is that ocean levels will rise 3 to 10 feet by the year 2300, depending upon future CO2 levels and temperature increases. At that point, however, it will still be rising at a rate more than double the current rate. It thus appears that a total sea level rise over 10 feet, largely if not entirely due to anthropogenic CO2 emissions, is inevitable in the long run.
  • In the next few decades, sea level rise will be mostly felt during acute events, such as during high tides or large storms, or a combination of the two. This will, unfortunately, cause my friends in Puget Sound to attribute their flooded living rooms to unusually high tides or large storms, but not to rising sea levels.

To examine flooding in Puget Sound under various levels of sea level rise, you can surf a map and toggle the level of sea level rise at this interactive website.


The recovery of the Bald Eagle: An Endangered Species Act success story

In the latter parts of the 1900s, the Bald Eagle faced extirpation in the Lower 48 from low reproduction. This was caused by their uptake of DDT from the fish they ate. The DDT caused their egg shells to be so thin they broke when they sat on them. For anyone with chickens, you know how variable eggshell thickness is, how much they vary depending on the birds’ diet and if they are getting enough calcium. Too thin and the eggs break; too thick and the chicks can’t break out.

BAEA recovery

Thanks to the Endangered Species Act, signed into law by Richard Nixon in 1973 back when the Republican Party considered conservation a conservative idea, the eagles are returning. They now nest in lakes even around downtown Los Angeles. In some highly polluted areas, such as the waters between Los Angeles and the islands off southern California, eggshells are only just now returning to normal. Everywhere across the Lower 48, the eagles are coming back. The battle is not over. The Republicans today are trying to overhaul the Endangered Species Act, which could again put this great bird at risk.