Helping forests migrate: Planners race to plant trees adapted to the future climate

Researchers from UC Davis collect acorns in arid west Texas to plant on their campus in northern California. They estimate their climate in 2100 will be similar to that of Barstow or even Phoenix today. City staff from a town near Portland, Oregon travel to California and Arizona for seedlings they can take home and plant along their city streets. They are preparing for Portland’s weather to become like Sacramento today.

The range of Arizona oak. For one town near Portland, Oregon, the list of potential future street trees includes this species, as well as California buckeye, California laurel, and silverleaf oak.

With these regions breaking new heat records annually – Sacramento just topped 90 degrees for the 110th day (and counting) in 2020—and given that trees take decades to mature, the race is on. Birds can fly, mammals can walk, but trees expand their ranges very slowly. Most acorns from an oak end up within a few hundred yards from their home tree.

Climate velocity, the speed at which ecotones are shifting north, is much faster than that. Our climate is changing ten to one hundred times faster than during a global warming event 55 million years ago known as the Paleocene-Eocene Thermal Maximum (PETM). During that “rapid” spike, palm trees successfully migrated to the Arctic circle, but they had thousands of years to make it there.

Dead blue oaks in Fresno County, California. They experienced excessive mortality during the 2012-16 drought. These hills may revert to grassland. Researchers want to use the genes of the survivors as stock for the future in the north. For a full presentation of blue oak gene-assisted migration see this presentation by the California Department of Fish and Wildlife.

While trees can’t walk, they can die. Range contraction of trees along their southern xeric (dry) edge is happening in the American West right with the speed of climate change. Blue oak die-offs are widespread in the southern third of their range. From California to Colorado, conifers such as Ponderosa pine and Douglas-fir are disappearing from lower elevations. To quote Davis et al (2019), “In areas that have crossed climatic thresholds for regeneration, stand-replacing fires may result in abrupt ecosystem transitions to nonforest states.” When people talk about California becoming Arizona, the cleanup hitter in that process may be fire, but the first batters are heat, drought stress, and bark beetles. After fires, decreased soil moisture and increased vapor pressure deficit (VPD) associated with climate change are leading to reduced probability of regeneration (Davis et al 2019). In short, many forests are not coming back.

Ponderosa pines are disappearing from lower elevations of the Sierra in California. This has been documented in Colorado as well.

Range expansion of trees northward has been documented, but the pace is anemic, insufficient to keep up with the changing climate. One study in the east found that ranges in adult trees expanded north less than 150 yards per year (Sittaro et al 2017). They concluded, “our results add to the body of evidence suggesting tree species are mostly limited in their capacity to track climate warming…”

Recent mega fires include many of the drought-killed conifers in the southern Sierra. Research suggests regeneration may be imperiled due to a warming climate.

Researchers have discussed facilitating tree migration due to climate change for over a decade (Aitken et al 2008). For over a hundred years, botanists have recognized regional differences within the same plant species, and simple garden experiments have shown that local varieties do better. The standard rule of thumb has always been that local varieties are best; they are adapted to the local ecological niche. Now that is changing.

Recent research is showing that trees are now in the wrong places; the climate has shifted past them. Valley oaks, white fir, Douglas fir, ponderosa pine, Western hemlock, and lodgepole pine seedlings all do better when removed from their original home and moved north (Aitken and Bemmels 2015).

The local trees are becoming misfits in a world that is changing around them. Many researchers are hesitant to fully embrace assisted migration; introducing non-native species has a horrid track record. But they are beginning to study “assisted gene flow”, moving hardy trees from the southern end of a species’ range to the north end. Cities, on the other hand, are beginning to see trees as more than just aesthetically pleasing; they are critical infrastructure, providing shade and reducing urban temperatures. So the cities and towns are moving faster, boldly cultivating trees from the dry Southwest into the Pacific Northwest. Likewise, the government of British Columbia is not hesitating. Assisted migration of Western larch and whitebark pine in Canada is already underway.

This photo from Aitken and Bemmels (2015) shows a series of Sitka spruce, all eight years old, planted together in British Columbia. The trees from the south, adapted for a warmer and drier environment, are out-competing the locals.

Tree migration is also critical for the range expansion of animals. Without the trees and other vegetation, many birds, mammals, and other forms of life have no habitat rungs on the ladder to enable them to move north as well. Anna’s Hummingbirds now winter in Canada and even Alaska, largely due to ornamental plantings. The Oak Titmouse, on the other hand, is dependent on oaks, tightly constraining its ability to expand north. It may be that, in the coming decades, oaks and other tree species planted in cities and towns will provide critical refugia for a wide variety of birds and insects seeking cooler climes.

Predicting winter irruptions: Correlating Red-breasted Nuthatch, Pine Siskin, and Red Crossbill winter invasions with previous years’ snowfall

I can almost do it; I’m just wrong this year.

IMG_4557

Pine Siskins in fall 2015 during the “superflight”. Davis, California.

Boreal seed-eating birds are notoriously unpredictable in their winter wanderings. Unlike a certain distinctive Dark-eyed Junco that once returned to my small apartment patio in Davis, California several winters in a row, these birds of the northern forests have no such allegiance to any patch of land. A Pine Siskin once banded in winter in Quebec turned up in California during a subsequent winter; other Pine Siskins banded in winter in New York and Tennessee spent a later winter in British Columbia; an Evening Grosbeak banded in winter in Maryland spent a later winter in Alberta; a Eurasian Siskin banded in winter in Sweden was later found in Iran; a Common Redpoll once wintered in Belgium, and later in China; another Common Redpoll banded in winter in Michigan was found during a later winter in Siberia (Newton 2006). In other winters, they hardly migrate at all. While up to 90% of band recoveries for many winter-banded species are pretty much where they were banded, that rate fall to about 1% for irruptive boreal species (ibid).

There’s a rich literature focusing on cone crop failure and irruptions of crossbills, redpolls, Clark’s Nutcrackers and other species (Reinikainen 1937, Lack 1954, Svardson 1957, Davis and Williams 1957 and 1964, Ulfstrand 1963, Evans 1966, and Eriksson 1970). To quote Newton (2006), “Clear evidence has emerged that major emigrations follow periodic crop failures.” Most recently, Wilson and Brown (2017) confirmed that Red-breasted Nuthatches are not fleeing bad weather nor are they attracted to specific food elsewhere; they are spreading across the land “because of failure of conifer seed production on the breeding grounds.” They are famine refugees. Other research has shown that, “despite the presumed benefits of irruption as an adaptive response to food shortage when population levels are high, negative population consequences can ensue.” Large irruptions are correlated with smaller numbers on Breeding Bird Surveys the following summer; they don’t all make it back (Dunn 2019).

Another factor, however, is high population densities of the birds (Bock and Lepthien 1976). Koenig and Knops (2001) reached some specific conclusions when they examined 30 years of Christmas Bird Count (CBC) data, focusing on multiple species, and compared it with data on cone crops. They found that Red-breasted Nuthatch, Black-capped Chickadee, Evening Grosbeak, Pine Grosbeak, Red Crossbill, Bohemian Waxwing, and Pine Siskin irruptions were “correlated with a combination of large coniferous seed crops in the previous year followed by a poor crop.” In short, a good year causes a pulse in reproduction, followed by a lean year which causes the expanded population to suddenly roam in search of food. There was some variation, with the good year or the bad year playing a more dominant roll for different species, but for most species, it was both. (And for Purple Finch, it seemed to be neither.) They concluded that “seed crops of boreal trees play a pivotal role in causing eruptions for a majority of boreal species, usually through a combination of large seed crop resulting in high population densities followed by a poor seed-crop, rather than seed-crop failure alone.”

RBNU Davis 10-12-15

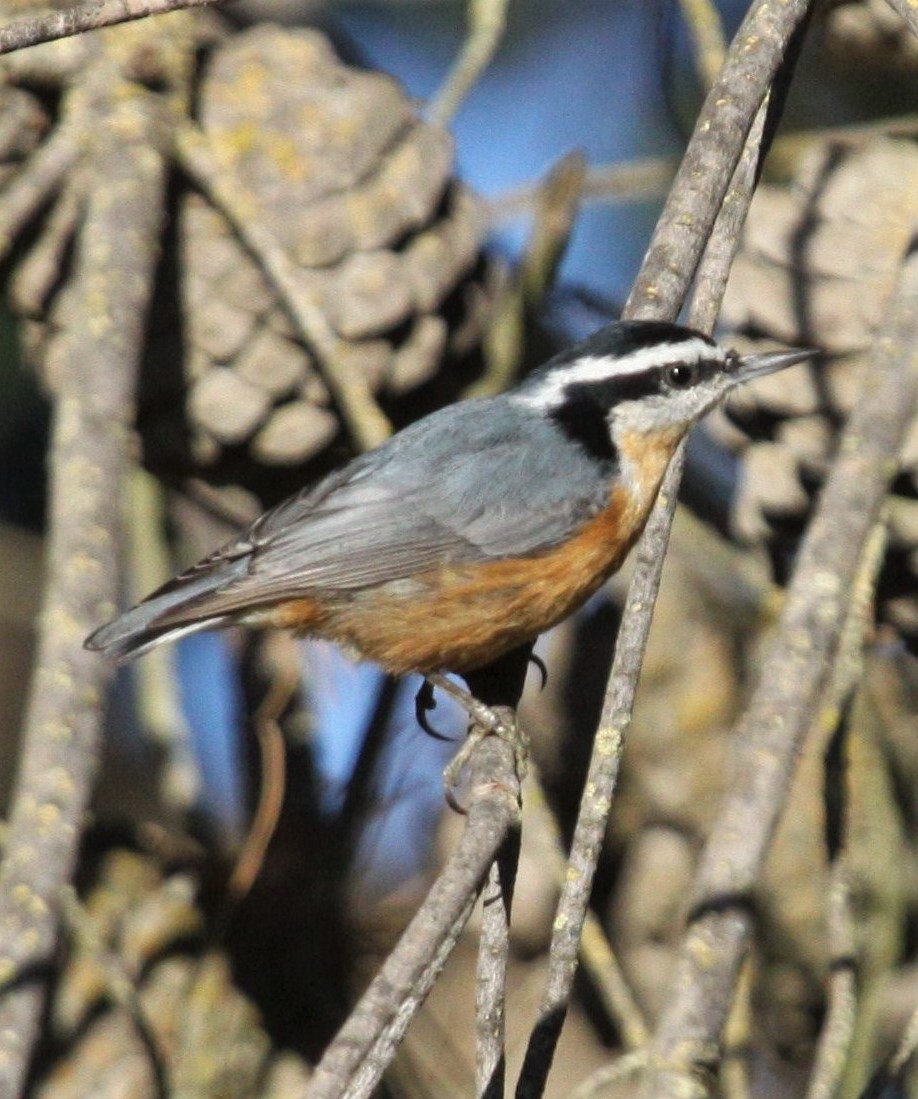
Red-breasted Nuthatch, also in Davis in fall 2015.

A year previously, Koenig and Knops (2000) studied just the trees, and concluded that various tree species often boom and bust in sync. They noted that “the large geographic scale on which seed production patterns are often synchronized, both within and between genera, has important implications for wildlife populations dependent on the seeds of forest trees for food. In general, resident populations of birds and mammals dependent on mast are likely to be affected synchronously over large geographic areas by both bumper crops providing abundant food and, perhaps even more dramatically, by crop failures.” Newton (2006) reported synchrony in boreal conifer seed production in forests 1000 km apart. Strong et al (2015) links Pine Siskin irruptions to continent-wide winter climatic patterns.

With synchronized cone crop failures, one would expect synchronized irruptions across bird species. The literature on this is supportive but mixed. Bock and Lepthien (1976) provide nice annual maps by species illustrating “generally synchronous” irruptions in many (but not all) years. Koenig (2001) offers the most comprehensive analysis, exploring synchronous irruptions among all combinations of 15 species, including multi-year lagged effects. (Here it’s important to understand correlation coefficients, or Pearson’s r. For guidance in interpreting r, 1.00 would be a perfect match, 0 would mean no correlation, and -1.00 would mean they do the exact opposite of each other.) Koenig’s highest correlation coefficients between two species were generally between 0.30 and 0.50. He also shreds an earlier assertion from Bock (1999) that there is strong correlation between Common Redpoll and Pinyon Jay irruptions; there was, but it didn’t last long.

Here I examine 49 years of CBC data (1970-2018) for Red-breasted Nuthatch, Pine Siskin, and Red Crossbill from the northern Central Valley of California, centered around Sacramento. I used data from eight CBCs: Caswell-Westley, Folsom, Lincoln, Marysville, Rio Cosumnes, Sacramento, Stockton, and Wallace-Bellota. I didn’t have any data on cone crops, but I assumed they might be correlated with precipitation the previous year, so I looked at snowfall. In short, I find some support for Koenig and Knops, but I wouldn’t bet more than a beer on it in any given year.

Here are the results.  CLICK TO ENLARGE.

irruptiongraph

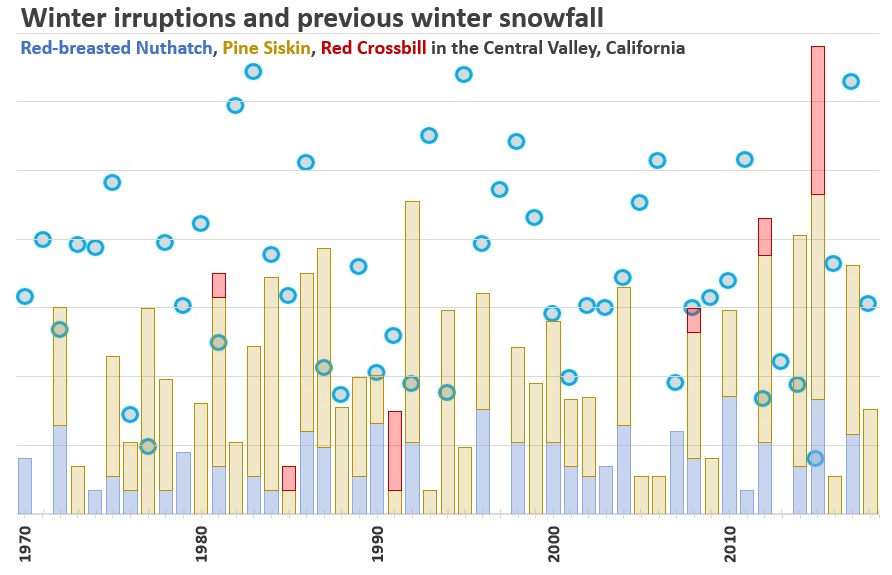
First, there are no units for the vertical axis. That’s because the units I used for the birds is basically an index. I converted them all to natural log (ln) because the numbers of siskins, which often occur in large flocks, dwarfed the nuthatches and crossbills. Converting to natural logs put them all more on a level playing field. What you’re seeing is the natural log of total individuals across all eight CBCs each year. (In most years, most birds were in the Sacramento CBC.) The blue circles are the water content (in inches) of the deepest observed snowpack from winter snow surveys at Upper Carson Pass from the previous winter. For example, the large irruption (or “superflight”) in 2015 occurred in the fall and winter of 2015-16, and the very low blue circle on that column is associated with the snowpack from the winter of 2014-15. In general, the snow surveys occurred in Jan-Apr and the CBCs in December of the same year.

A few quick observations from the chart:

  • Red Crossbills only occurred in six of the 49 winters, but 4 of those were during nuthatch/siskin irruptions. The only large crossbill irruption occurred in 2015, on top of the largest combined nuthatch/siskin invasion. The 2015 superflight also coincided with the lowest snowpack the previous winter, which came at the end of a four-year drought. So 2015, as an extreme event, tells us a few things. Previous snowpack is important, and correlation across species does occur.
  • Most of the other highest irruption years (1981, 1987, 1992, 2012) all came after low snowpack years, and all had higher snowpack the year before that, exactly what Koenig and Knops would predict.

And now for some math:

  • The correlation coefficient between nuthatches and siskins is 0.32, so they do tend to irrupt together-ish, but not always and certainly not in the same magnitude. Koenig writes, “For Red-breasted Nuthatch and Pine Siskin, synchrony over different 10-year periods varied from a high of 0.82 (1965-1974) to a low of 0.24 (1987-1996).” His sample included eastern North America, which he showed follows different patterns than the West.
  • I then looked at correlation between the cumulative nuthatch/siskin/crossbill irruptions (in natural log, so the full blue, yellow, and red columns in the graph) and a variety of other parameters. Here are the results:
    • Correlation with previous winter’s water content from snowpack (the blue circle): -0.44.
    • Correlation with water content more than 5″ below average: 0.41.
    • Correlation with multiple years of drought: 0.37.
    • Correlation with a 10″ drop in water content from the year before that (thus going from a good year to a worse year): 0.38.
    • Correlation with the same 10″ drop in water content, but only if the recent year was below average (thus, going from a good year to a bad year): 0.40.

So these correlations all lean in the right direction, supporting Koenig and Knops’ notion that bad years are bad, and bad years after good years are even worse. I would also add that bad years after bad years (a drought) are also bad.

These correlations come with some caveats. First, the correlation between snow water content and cone crop is imperfect. Koenig and Knops (1999) state that, while recent precipitation is indeed an important variable, it’s not the only one. Spring and summer temperatures play a role in cone development, as well as previous seasons. After a really good year, trees need a break, regardless of rainfall, and will produce less. An example might be 1984, where there was an irruption after an average snow year, but two really heavy precipitation years preceded that.

Another source of noise in the data is that our birds, especially the siskins, may be coming from much further afield than Tahoe. (I deliberately left out Evening Grosbeak because call types from our last invasion suggested the birds were brooksi from Washington state or somewhere up there.)

Donner Jan20-2015

Donner Pass without snow. January 20, 2015.

While it may seem that the data on irruptions and snowpack tell a compelling story, let’s not forget the present. It’s fall 2019 and we’re in the midst of a significant Red-breasted Nuthatch irruption (and I’ve seen one siskin as well). This year is not on the graph above, but we do already have the snowpack data from earlier in the year. It was way above average. Thus, we’ve just gone from an average snowpack year in 2018 to above-average in 2019, the opposite of what should prompt an irruption. If you bet me a beer, I’d owe you one.

References

Bock, C.E. 1999. Synchronous Fluctuations in Christmas Bird Counts of Common Redpolls and Piñon Jays. The Auk 99: 382-383.

Bock, C.E. and L.W. Lepthien. 1976. Synchronous eruptions of boreal seed-eating birds. American Naturalist 110: 559- 571.

Davis, J. and L. Williams. 1957. Irruptions of the Clark nutcracker in California. Condor 59: 297–307.

Davis, J. and L. Williams. 1964. The 1961 irruption of the Clark’s nutcracker in California. Wilson Bulletin 76: 10–18.

Dunn, E.H. 2019. Dynamics and population consequences of irruption in the Red-breasted Nuthatch (Sitta canadensis). The Auk 136.

Eriksson, K. 1970. Ecology of the irruption and wintering of Fennoscandian redpolls (Carduelis flammea coll.). Annals Zoologica Fennici 7: 273–282.

Evans, P.R. 1966. Autumn movements, moult and measurement of the lesser redpoll, Carduelis flammea. Ibis 106: 183–216.

Koenig, W.D. 2001. Synchrony and Periodicity of Eruptions by Boreal Birds. The Condor 103: 725-735

Koenig, W.D. and J.M.H. Knops. 2000. Patterns of annual seed production by Northern hemisphere trees: a global perspective. American Naturalist 155: 59-69.

Koenig, W.D. and J.M.H. Knops. 2001. Seed-crop size and eruptions of North American boreal seed-eating birds. Journal of Animal Ecology 70: 609-620.

Lack, D. 1954. The Natural Regulation of Animal Numbers. Clarendon Press, Oxford.

Larson, D.L. and C.E. Bock. 1986. Eruptions of some North American seed-eating birds. Ibis 128: 137-140.

Newton, I. 2006. Advances in the study of irruptive migration. Ardea -Wageningen 94: 433-460.

Reinikainen, A. 1937. The irregular migrations of the crossbill, Loxia c. curvirostra, and their relation to the cone-crop of the conifers. Ornis Fennica 14: 55-64.

Svardson, G. 1957. The ‘invasion’ type of bird migration. British Birds 50: 314-343.

Ulfstrand, S. 1963. Ecological aspects of irruptive bird migration in Northwestern Europe. Proceedings of the International Ornithological Congress 13: 780–794.

Wilson Jr., W.H. and B. Brown. 2017. Winter Movements of Sitta canadensis L. (Red-breasted Nuthatch) in New England and Beyond: A Multiple-scale Analysis. Northeastern Naturalist 24.

whit! Sorting out the call notes of western Empidonax flycatchers

After a flurry of migrant Empidonax flycatchers this April in California, a number of us engaged in a discussion about their whit! call notes. Specifically, could we tell Willow from Dusky from Gray just by the whit? Personally, I’m not there yet. I usually only hear them a few times a year, which is insufficient experience, and I suspect there’s individual variation as well as the tricks that wind, humidity, and distance play on sound. But what about analyzing their sonograms with a good recording?

I looked at the very best on-line recordings from the Macaulay Library (collected via eBird, and there’s a collection of the best ones at Peterson Bird Sounds) and from xeno-canto. (Warning: the horizontal axis is different between their sonograms. Xeno-canto sonograms fit about two seconds in the space where Macaulay fits one second of recording, thus compressing the sonogram. Here, I stretched the xeno-canto sonograms horizontally to adjust for that.)

Willow whits

Dusky whits

Gray whits

It appears that Willow, with a good recording, is distinctive, with up to three harmonic tones and that downward slope after the upward slow. To the ear, the Willow whit is softer and sweeter than the others. Dusky and Gray, on the other hand, are both dry sharp whits, and virtually indistinguishable on the sonograms. Gray is more likely to go up to 10 kHz or higher, and that echo line on the first Gray sonogram was consistent on all the calls, at least for that individual recording. For the record, Least was similar to Dusky and Gray, although the triangular dark shadow to the right of the main call tended to be thicker and larger.

iPhone whit

iPhone recording

To the right is a typical iPhone recording, probably a Dusky. Based only on this sonogram, just a shadow of the good ones above, it could be any of the species. The take-home lesson is that one could probably diagnostically identify a Willow whit from a sonogram with a very good recording. The Dusky and Gray whits are too close to call.

Our discussion also focused on spring migration timing and incorporated Hammond’s (as many of these birds are silent). Again, I turned to eBird for some trends.

CLICK TO ENLARGE

whit map

Spring migration for western Empids. These maps are based on 2017-18 data. I excluded a few outliers in each case. Nevertheless, these dates represent the earliest arrivals. Most birds were a week later than the dates shown.

The results are that Hammond’s is the earliest, followed by Gray and then Dusky. For all three, however, there was a pulse of records during the last week of April. Willow is a full month behind the other two. In fact, even in southern Arizona there were very few Willow records before May 10.

Kaufmann empids
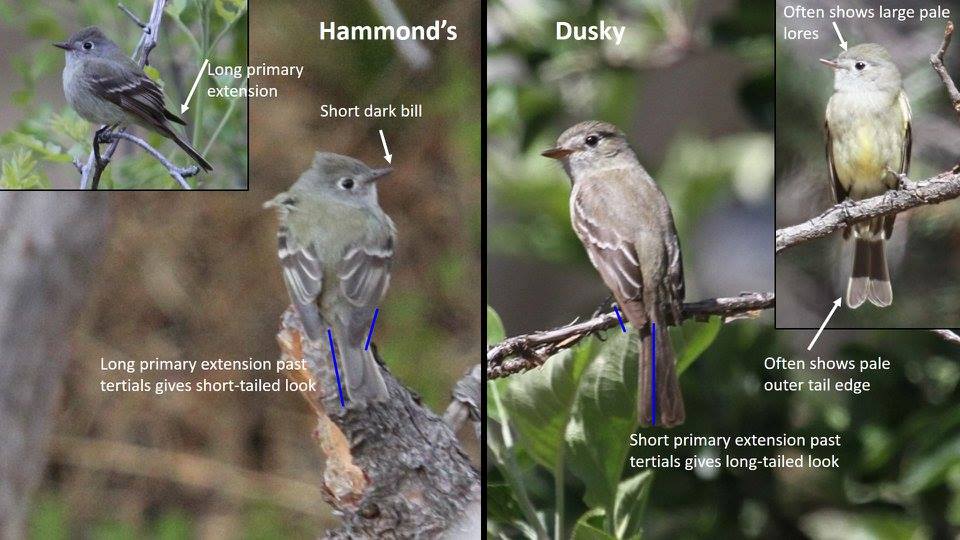
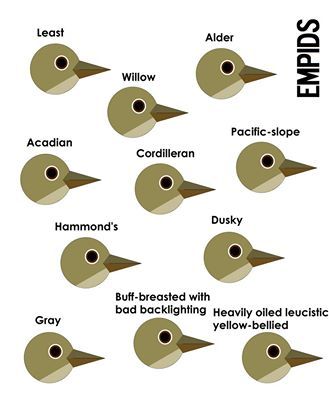
Much has been written about Empid identification. Here’s a link to the Rowland 2009 article in Birding. My personal favorite is the chapter in Kenn Kaufmann’s Advanced Birding. The diagram at left is from the old version; the new one is even better, showing variations within species.

For the Hammond’s/Dusky challenge in spring, I put together the diagram below. These identifications were confirmed by calling birds, which are easily separated (Hammond’s says peep rather than whit).

HammondsDusky

Finally, if you’re still confused, there’s this infamous meme:

empid meme

Spring Migration in the Central Valley

0V2A2892

Compared to fall, spring migration is fast and furious. It ramps up thru April, peaks in early May, and then ends abruptly. Birds don’t stay long; they’re in a hurry. Rarities rarely last more than a day. And there are fewer birds than in the fall, winter mortality having taken its toll. But, like this Lazuli Bunting, the birds are in their best dress.

In 2010, after ten years of collecting data on morning “warbler walks” in my local patch in Davis, the Central Valley Bird Club Bulletin published my results. You can read the whole paper here:

Hampton, S. 2010. Passerine migration patterns in Davis, Yolo County—2000-2010. Central Valley Bird Club Bulletin 13(3): 45-61.

Last fall, I posted a re-visualization of the data from that paper with regard to fall migration. Here is the spring version.

I’ve divided it into two graphs, one for more common species (peaking at 1 to 4.5 birds per survey), and another for less common migrants (less than 1 per survey).

CLICK TO ENLARGE.

DavisMigrants1spring

CLICK TO ENLARGE.

DavisMigrants2springThe same caveats apply:

  • A “survey” here is basically a morning walk lasting about 35 minutes.
    This was for my little route in north Davis (where the eBird hotspot is “North Davis Farms Subdivision”). For other locations in the Central Valley, even nearby ones, I would expect the numbers and relative abundance to vary a little. For example, I see a lot more flycatchers at Babel Slough and Grasslands Park than are reflected here.
  • Putah Creek near Pedrick Rd, a current favorite of birders, generally has more birds than is shown here because it’s a larger area, birders spend more than 35 minutes when they visit, and the habitat is slightly different.
  • A large portion of the birds in my data are “heard only”.
  • For additional details, see the full article linked above. I’m happy to provide my Excel spreadsheets of this data to anyone interested.

0V2A2610

Some species are more common in spring than fall. These include Hermit Warbler (above), Townsend’s Warbler, and Swainson’s Thrush (with a very narrow migration window in mid-May).

I’ve also linked lots of the bird literature specific to Yolo County at my Yolo County Birding website; see the list of papers in the lower right corner of that page.

On these graphs, I’ve left out the rarer birds, species that occur at a rate of less than 0.2 birds/survey (less than 1 out of every 5 surveys). These include Hammond’s and Dusky Flycatchers. It also includes Willow Flycatcher, House Wren, MacGillivray’s Warbler, Common Yellowthroat, and Chipping Sparrow, all of which are quite regular in the fall but rarely seen in spring migration.

The 2018 flight of the Buff-breasted Sandpipers: Data from the West Coast

Buff-breasted Sandpipers breed on the Arctic tundra from western Alaska, across northern Canada, to Baffin Island. They winter eight thousand miles to the south, on the grasslands of the River Plate Basin in Argentina, Uruguay, and Paraguay. Their primary migration corridor is east of the Rockies, through the central United States. A secondary route is along the East Coast. They are always rare in fall migration along the West Coast, with four to fourteen individuals counted each fall between 2014 and 2017. In spring, they are almost unheard of (there is one record in eBird from Arcata, California in May, 1980).

Fall migration in 2018 was exceptional on the West Coast, with sixty-five individuals reported, five to ten times the norm. The figure below summarizes eBird data from the past five years in southern British Columbia, Washington, Oregon, and California.

CLICK TO ENLARGE.

BBSA

A few interesting points:

  • While fall migration generally spans from mid-August thru late September, the timing of records within that period are not strongly correlated with latitude.  That is, it does not appear that birds are moving from north to south through the period. Each season’s latest records, from mid or late September, may come from British Columbia or Washington as easily as from southern California. That said, in 2018, the latest records are indeed from southern California. Moreover, the very few October records over the years (not included in the graph) are from southern California.
  • They are most reliable in the Pacific Northwest, only reaching California in years of relative abundance, such as 2018. The only location with records from every year is Salmon Arm Bay of Shuswap Lake, in the interior of British Columbia. Other sites, with records in all but one year, are Boundary Bay, British Columbia, and the south coast of Washington (e.g. Ocean Shores, Gray’s Harbor vicinity).
  • The vast majority of records are of single individuals. The only time more than four birds were documented together during these years was in 2018, with five birds at once at Sauvie Island, Oregon, and a remarkable thirteen at Boundary Bay.
  • In the years 2014-2017, Buff-breasted Sandpipers first appeared between August 15 and 19. In 2018, they did not appear until August 23, and most were relatively later than birds in previous years.
  • In 2018, there were several records from offshore California: one from the Farallons, two from San Clemente Island, and two birds seen together from a pelagic trip one hundred miles off southern California. These were all relatively early in migration, between August 25 and September 1. In contrast, most 2018 records from the Oregon coast were from the first week of September.


Fall Migration in the Central Valley

warblers fall 2018In 2010, after ten years of collecting data on morning “warbler walks” in my local patch, the Central Valley Bird Club Bulletin published my results. You can read the whole paper here:

Hampton, S. 2010. Passerine migration patterns in Davis, Yolo County—2000-2010. Central Valley Bird Club Bulletin 13(3): 45-61.

Mac

Bay Area birders are surprised when I tell them Willow Flycatchers and MacGillivray’s Warblers (above) are daily in fall migration in Davis.

It begins with this:
“Although passerine migration may conjure images of Point Reyes for many local birders, the Central Valley, with its north-south orientation, is believed to be the primary migration corridor through California for most species, surpassing the coastline in this regard (Humple and Geupel 2002).”


Here, I’ve re-visualized my results for fall migration in two simple graphs, one for more common species (peaking at 2 to 13 birds per survey), and another for less common migrants (around 1 or less per survey).

CLICK TO ENLARGE.

DavisMigrants1

DavisMigrants2

A few caveats:

  • A “survey” here is basically a morning walk lasting about 35 minutes.
    This was for my little route in north Davis. For other locations in the Central Valley, even nearby ones, I would expect the numbers and relative abundance to vary a little. For example, I see a lot more flycatchers at Babel Slough and Grasslands Park than are reflected here.
  • Putah Creek near Pedrick Rd, a current favorite of birders, generally has more birds than is shown here because it’s a larger area, birders spend more than 35 minutes when they visit, and the habitat is slightly different. It seems better at holding fall migrants for more days, making their detection more likely.
  • On these new graphs, I’ve left out the rarer birds, species that occur at a rate of less than 0.2 birds/survey (less than 1 out of every 5 surveys).
  • A large portion of the birds in my data are “heard only”.
  • For spring migration and additional details, see the full article linked above.

This last graph provides a cumulative view of all the migrants at once. Peak diversity is in late August. After that, the Yellow Warblers take over. After that, not shown here, the Yellow-rumped Warblers, both Audubon’s and Myrtle, arrive, signalling the end of fall migration.

DavisMigrants3

It would be interesting to compare these relative abundances and timing with more recent eBird data, both in north Davis (where the eBird hotspot for this survey area is “North Davis Farms Subdivision”) as well as other locations in the Central Valley. Have at it. I’m happy to provide my Excel spreadsheets of this data to anyone interested.