

Many papers predict that bird ranges will shift northward with a warming climate (Wu et al 2018, Langham et al 2015).
Many studies have already documented that this is happening (Illán et al. 2014, Virkkala, R. and A. Lehikoinen 2014, Hitch and Leberg 2007, and La Sorte and Thompson 2007).
And some have documented poleward range shifts specifically for wintering ranges (Saunders et al 2022, Hampton 2019, Paprocki et al 2017, Prince and Zuckerberg 2016, and Paprocki et al 2014).
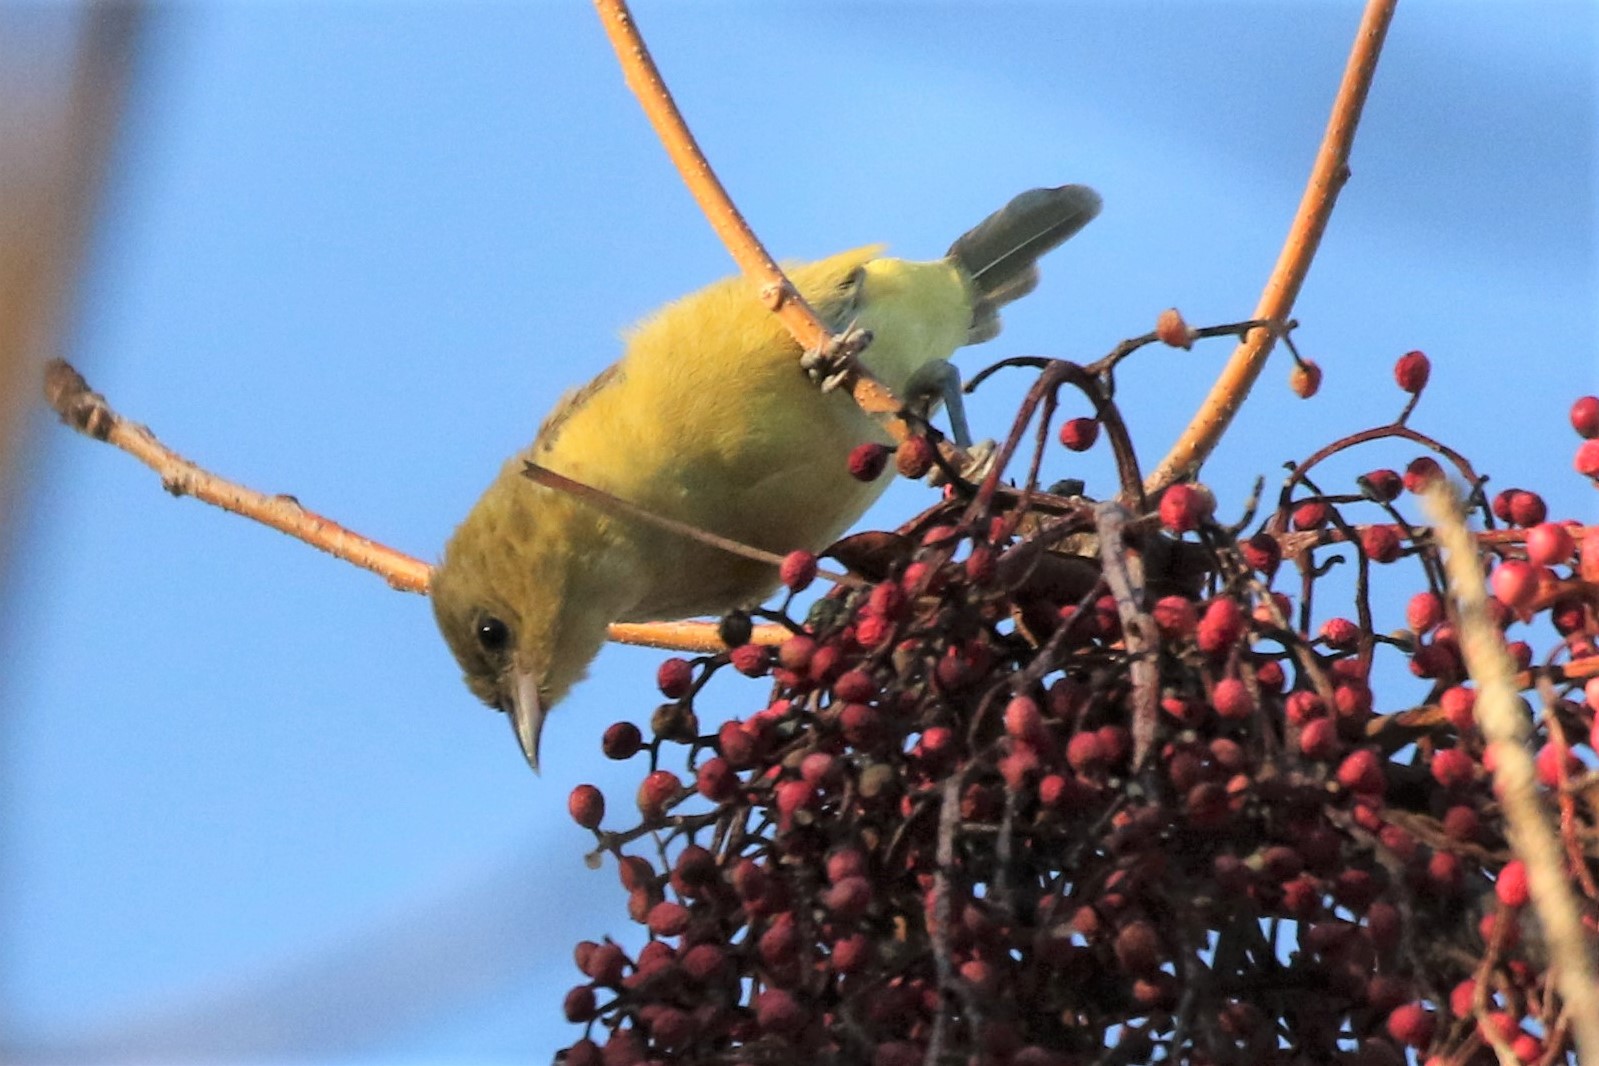
I’ve previously written about an increase in insectivore bird species in winter associated with a warming climate in the Sacramento Valley. As the Putah Creek Christmas Bird Count (CBC) compiler, it was hard not to notice the trends. Cassin’s Vireo, Black-throated Gray and Townsend’s Warblers, and Western Tanagers were becoming more expected in winter. We had crossed a threshold; we didn’t get freezes anymore. My bougainvillea and cape honeysuckle, which previously clung to life in winter, were now growing and blooming year-round. Fruit and insects were available to these birds.
Now in Port Townsend, Washington, we set a local CBC record for Yellow-rumped Warblers last year. This caused me to take a closer look at the data, focusing on Passerines that are rare or uncommon, and at the northern edge of their wintering range. They are: Hermit Thrush, Cedar Waxwing, Lincoln’s Sparrow, White-crowned Sparrow, Orange-crowned Warbler, and Yellow-rumped Warbler. For each of these, the PNW is at the northern limits of their wintering range.
I looked at their numbers and trends on the Portland, Olympia, Seattle, Bellingham, and Vancouver BC CBCs since the 76th CBC (winter 1975-76). I’ve got more notes on my methodology at the end.
Results
All have increased since 1975, generally with the uptick beginning in the 1990s. Here are the results of my inquiry.
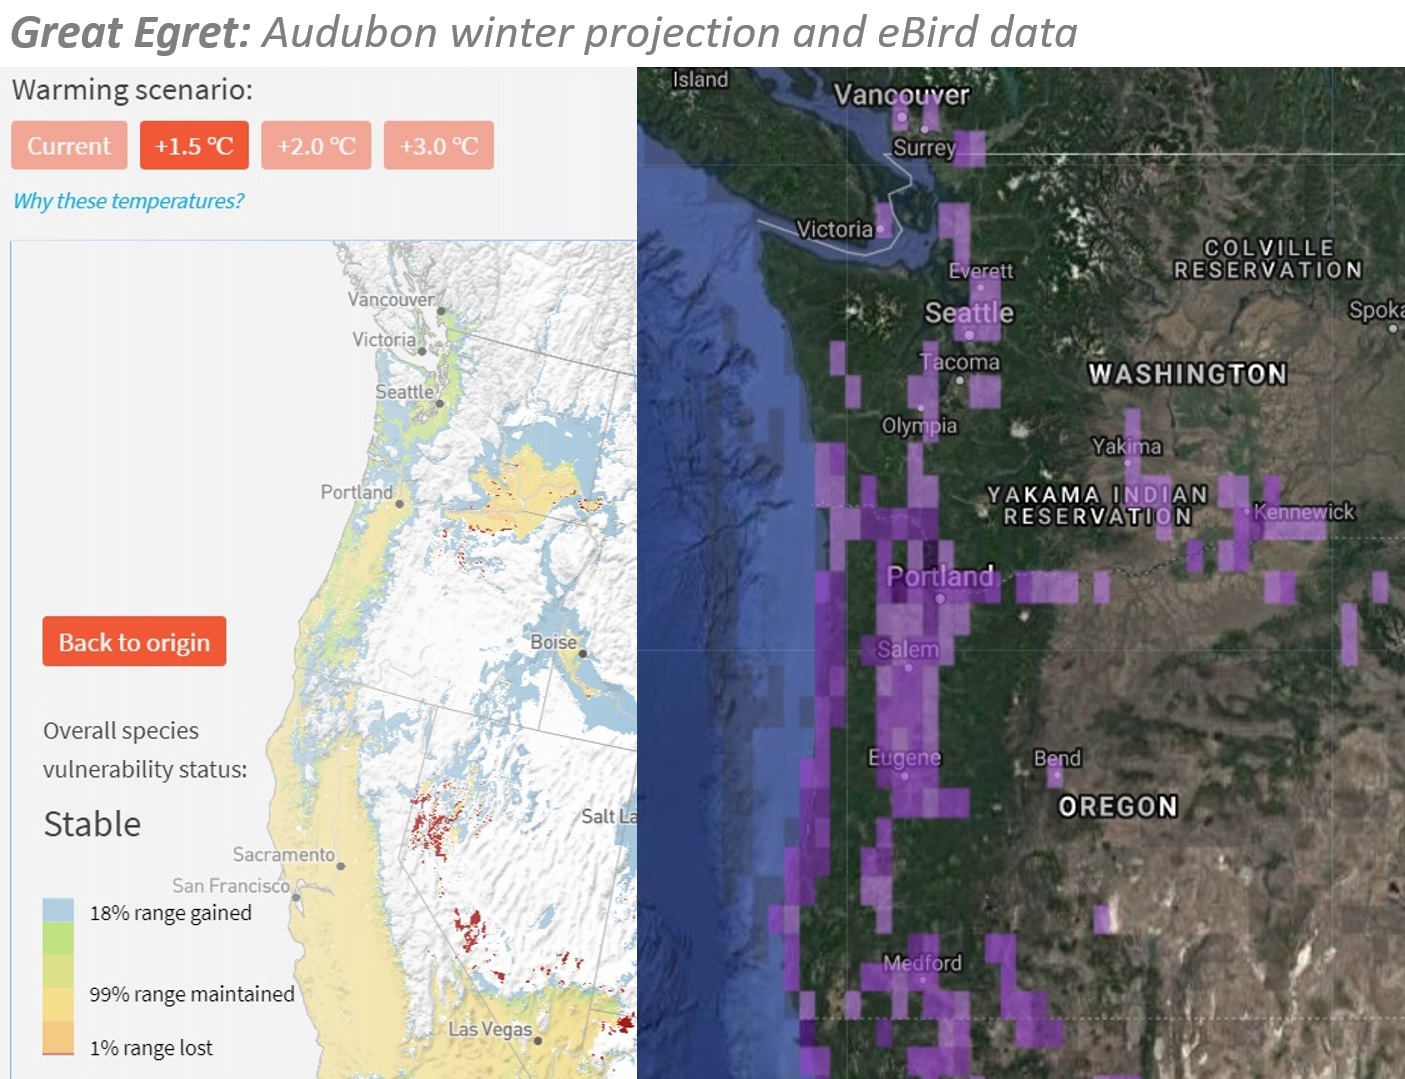
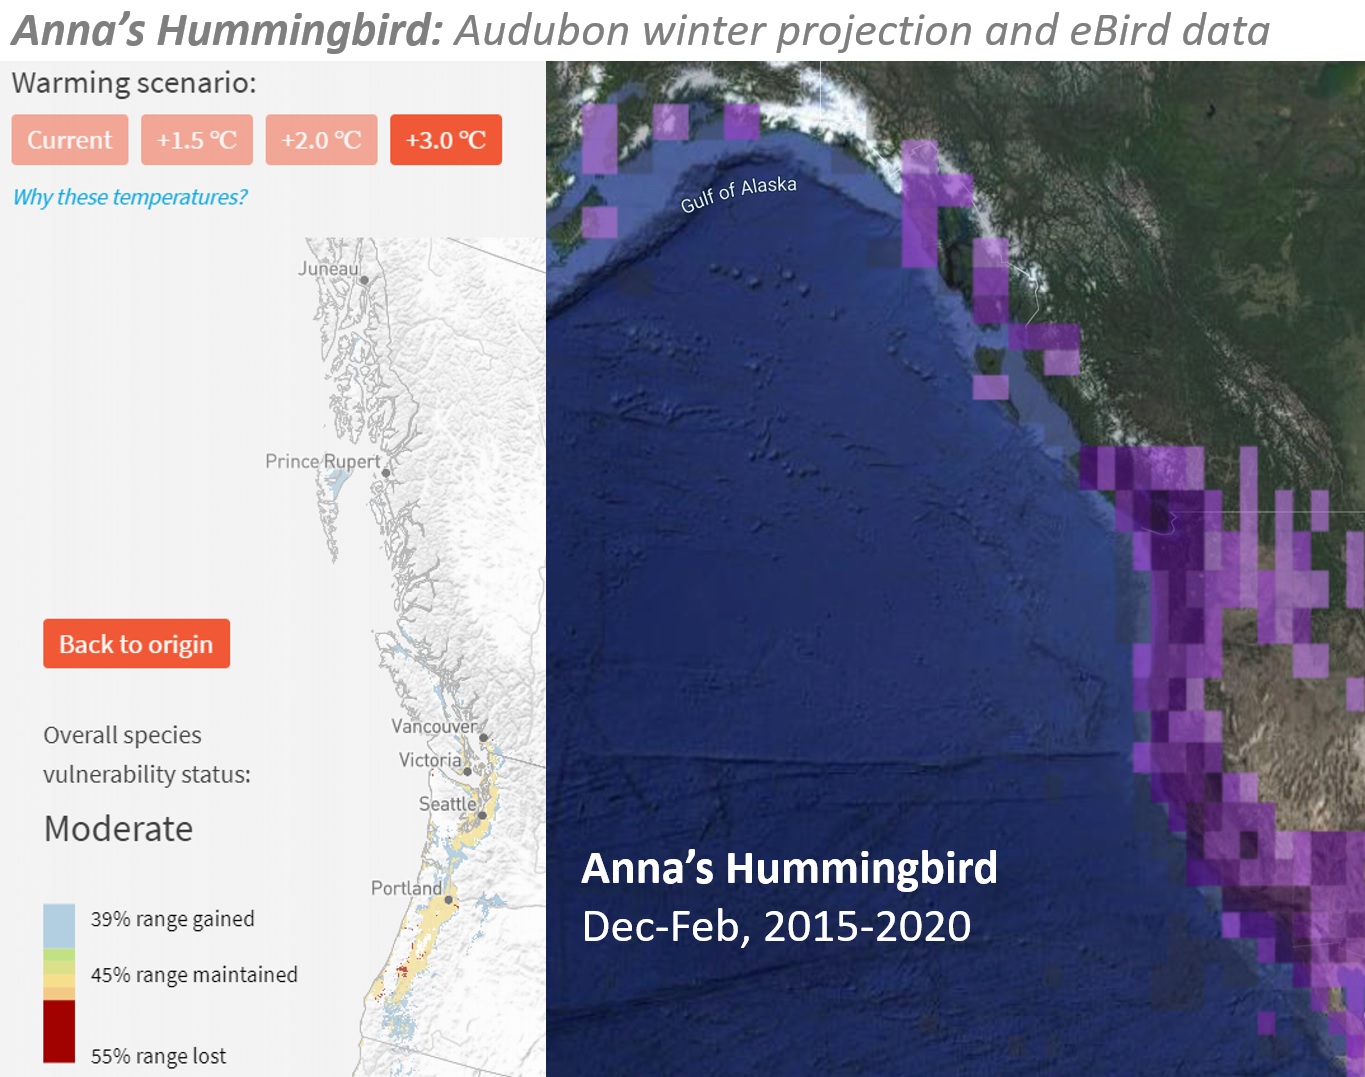
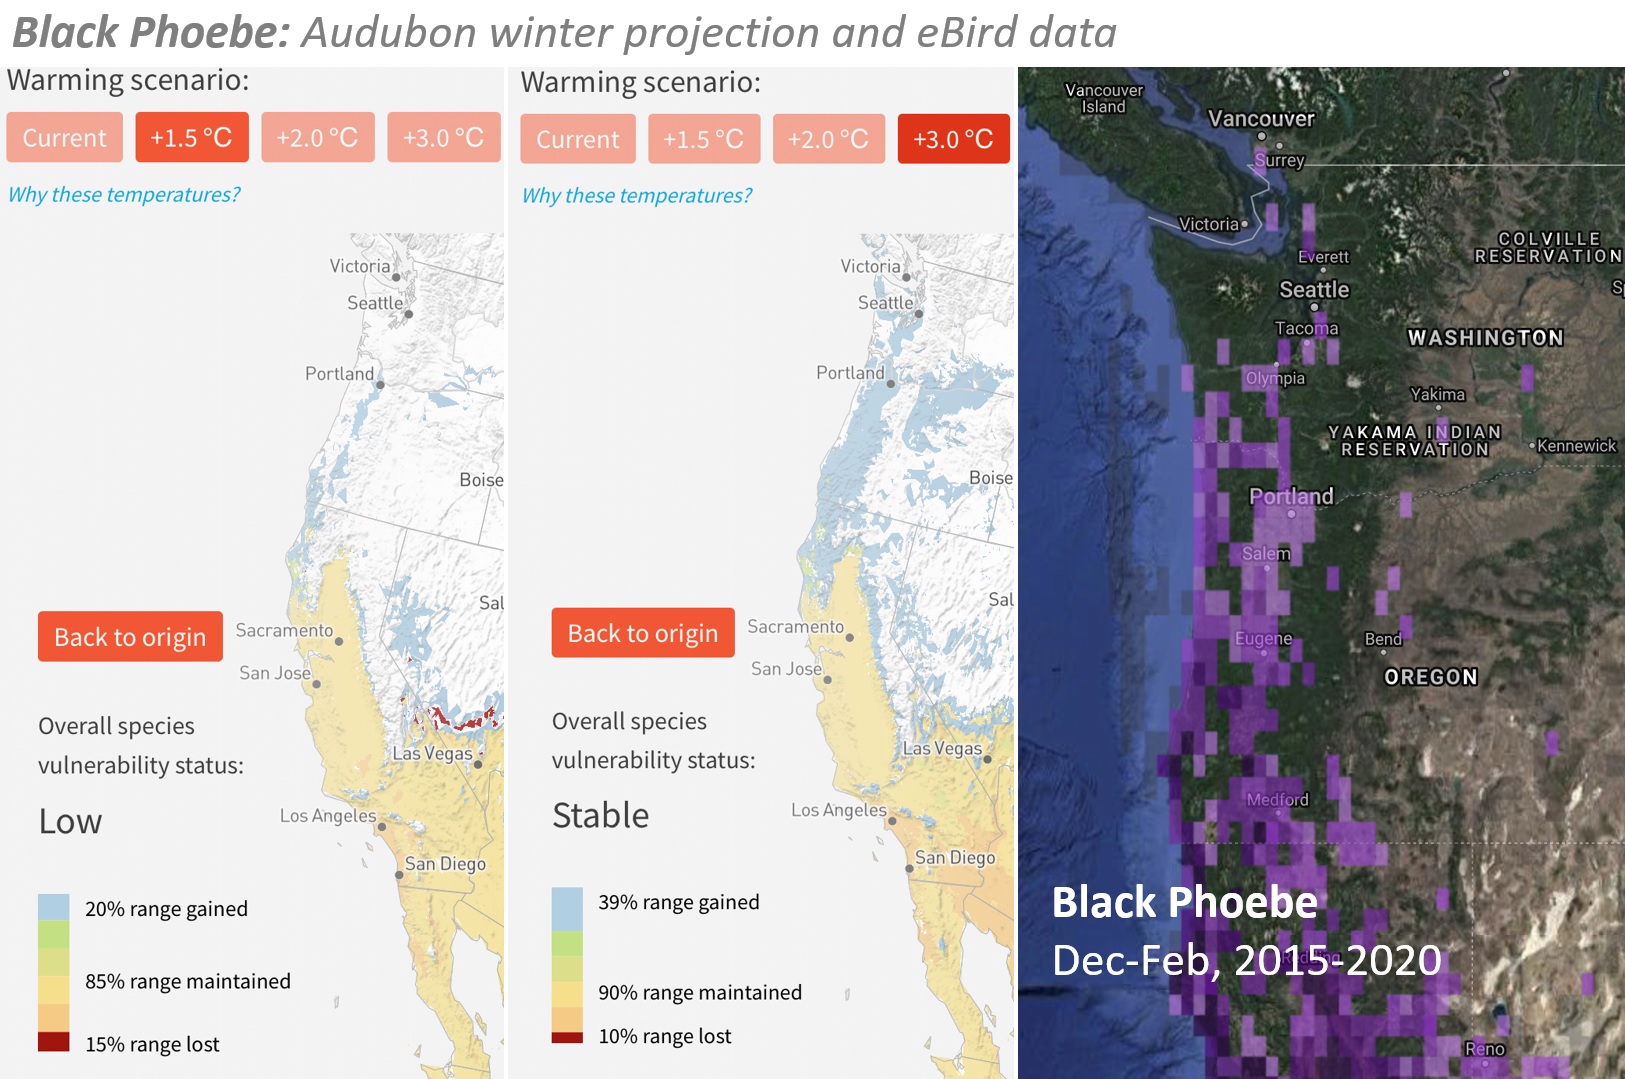
The range maps are from eBird’s Abundance Maps. Red=summer; blue=winter; purple=year-round; yellow=migration. The graphs show the birds per party hour across the five CBCs, taking the total number of birds and dividing by the total number of hours across all five counts.
Hermit Thrush

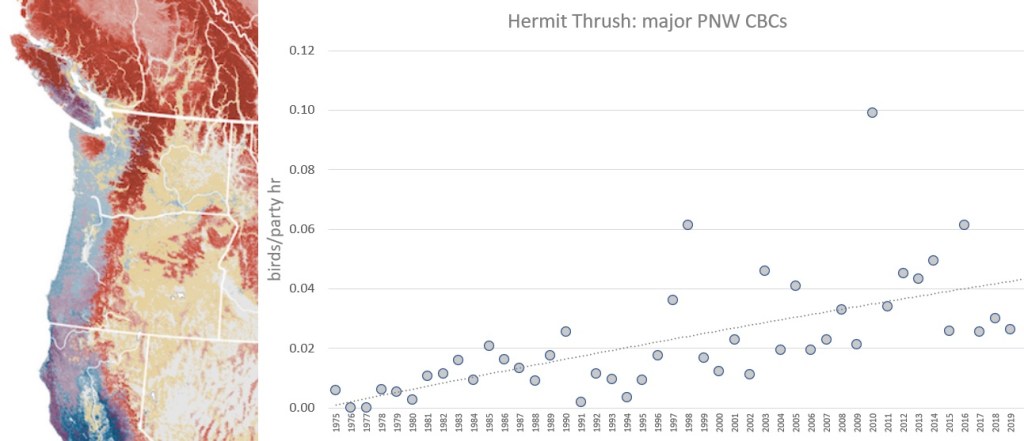
Hermit Thrush has been increasing at a rate of 4.2% per year across all the CBCs. It has been increasing across all five of the counts, most strongly in Vancouver (4.1% annual growth) and most tepid in Seattle (0.6%). It is most common on the Portland count, which has averaged 26 Hermit Thrushes per count since 2009.
Cedar Waxwing


Of the six species I focused on, Cedar Waxwing showed some of the most erratic growth, averaging only 2.5% per year. That said, it has been above average 8 of the last 9 years. To illustrate the unpredictable nature of waxwings, they have actually been declining on the Olympia (-2.3%/yr) and Vancouver (-4.1%/yr) counts. They are increasing the most on the Portland count (3.0%/yr).
Lincoln’s Sparrow

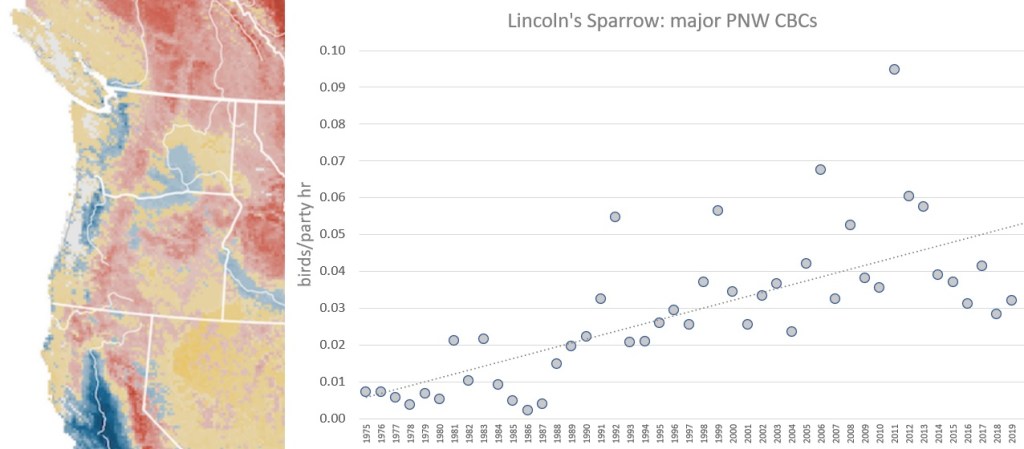
Lincoln’s Sparrow has been increasing steadily, from near zero, at an overall rate of 3.6% per year. To put this in perspective, these five CBCs tallied 5 or fewer individuals, summed across all counts, in each of the first five years of this analysis. In each of the last five years, these counts, in aggregate, tallied between 34 and 52 individuals. Growth has been strongest on the Olympia count (4.6%/yr) and weakest on the Bellingham count (1.7%/yr).
White-crowned Sparrow
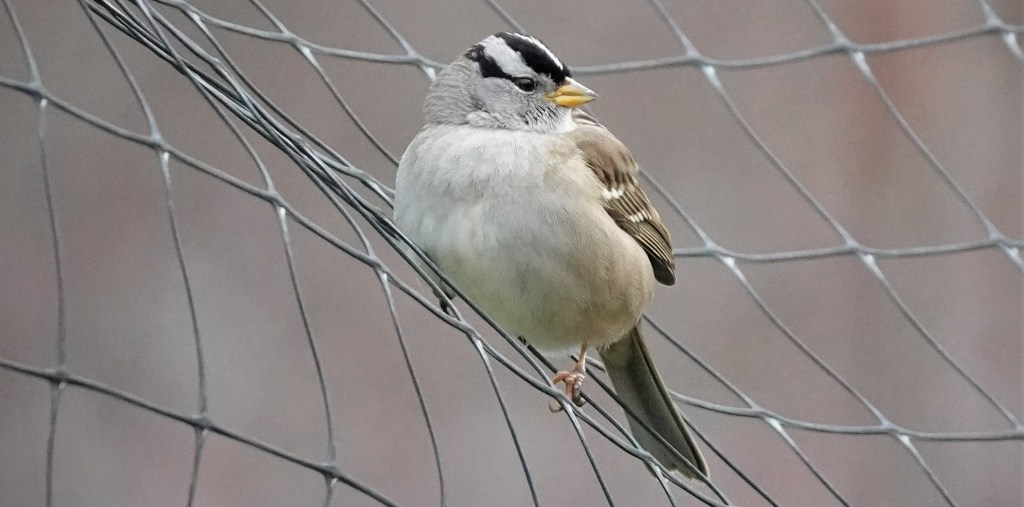

Despite the eBird map, White-crowned Sparrow is a regular overwintering species in the PNW. The five counts, in aggregate, tally between 100 and 750 individuals each year. They’ve been increasing at a rate of 1.8% per year, strongest in Seattle (3.1%/yr) and weakest in Vancouver (-2.5%/yr, the only count with declining numbers).
Orange-crowned Warbler
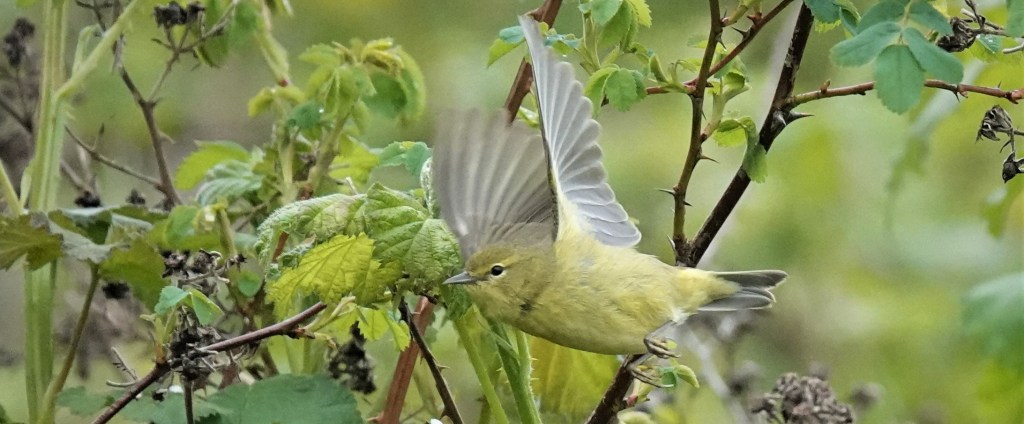

Orange-crowned Warbler has seen dramatic increases, averaging 5.0% per year, highest in Olympia (7.2%/yr) and lowest in Bellingham (3.2%/yr). The numbers, however, are still small. Aggregate numbers across all counts were zero five of the first eleven years of this analysis (easily seen on the graph). Double digits were not reached until 1999. The last ten years, however, have averaged 15 individuals across all the counts, making this an expected species in winter now.
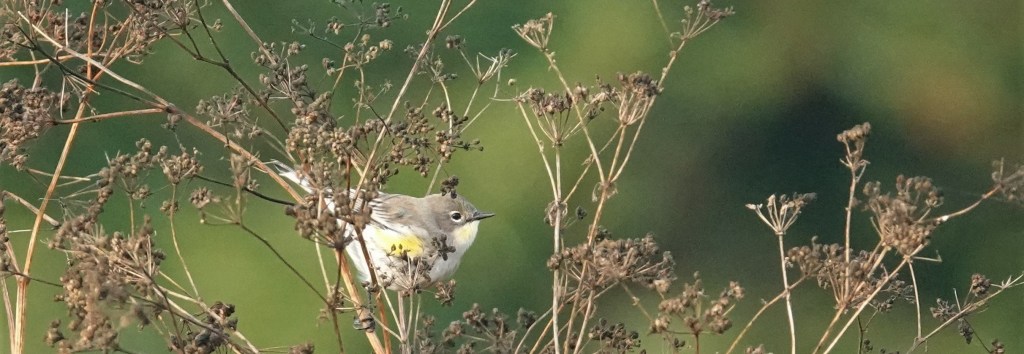
Yellow-rumped Warbler

Yellow-rumped Warbler wins the award for poster child of species increasing in winter at the northern edge of their wintering range. They’ve been increasing at a rate of 5.3% per year. Interestingly, this growth is concentrated in the south. Portland (3.7%/yr), Olympia (3.4%/yr), and Seattle (6.1%/yr) have seen the most growth, while Bellingham (-0.5%) and Vancouver (-5.0%) have seen declines. Perhaps those Fraser River winds are too cold for warblers.
Methodology
The data includes bird per party hour for the Portland, Olympia, Seattle, Bellingham, and Vancouver BC Christmas Bird Counts from the 75th count (winter 1975-76) to the 120th count (winter 2019-20). The 121st count was impacted by the pandemic.
CBC (and Breeding Bird Survey) data is uniquely advantageous for looking at long-term trends such as climate change, as they both go back many decades with generally similar effort over time (for certain well-established counts). Nevertheless, there were some issues with this data:
- I did not use the Portland data from the 76th thru the 82nd count, due to aberrantly low party hours relative to later counts.
- The following data was missing entirely from the Audubon CBC database: Olympia 76th, 77th, 78th, 84th, 104th, and 110th counts; and Seattle 91st count.
- The following counts had no (or obviously incorrect) data for party hours: Portland 104th count; Bellingham 111th, 112th, and 119th counts. Because they did have bird numbers, I approximated the party hours based on their counts in nearby years. I used 230 party hours for the Portland count and 200 party hours for the Bellingham counts.
Other climate-related bird changes in the Pacific Northwest
I’ve previously blogged about climate change and birds in the Pacific Northwest:
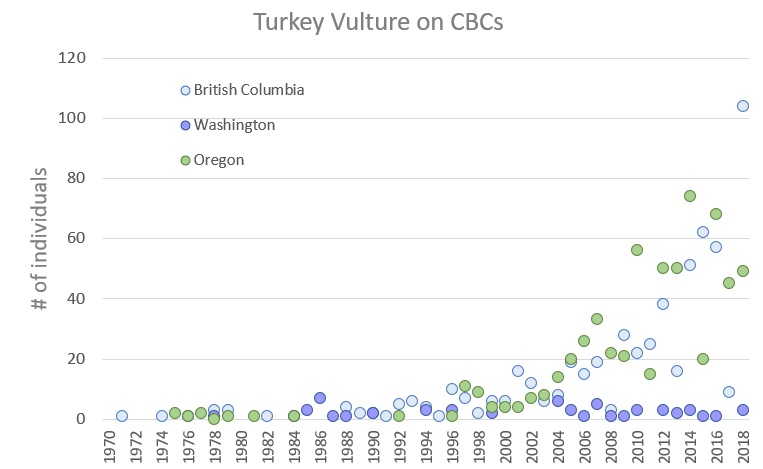
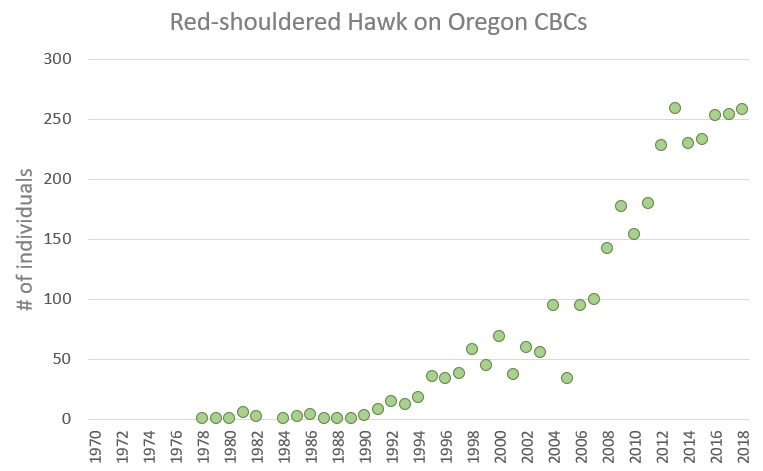
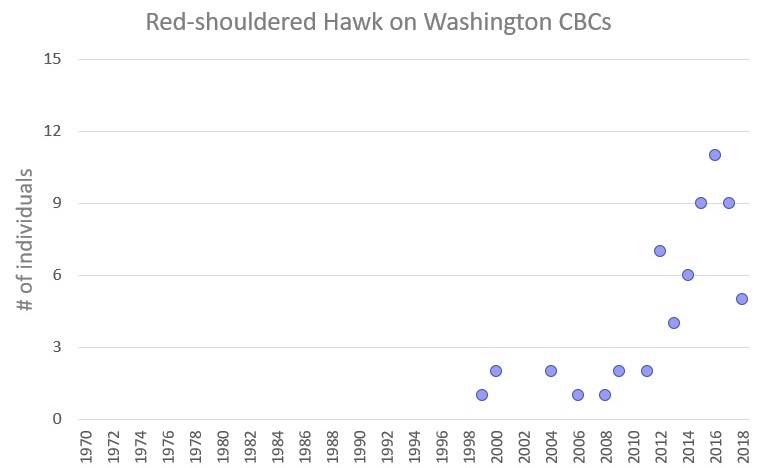
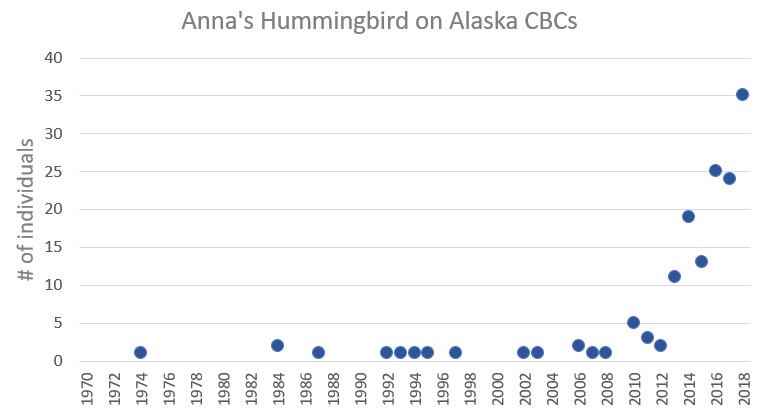
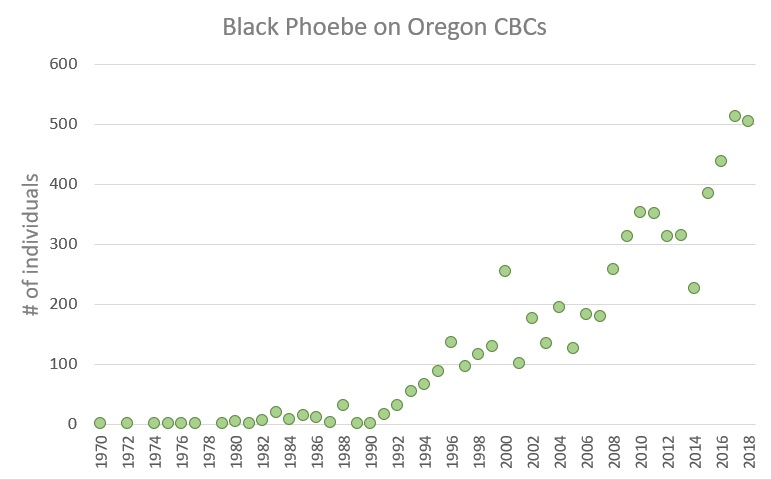
The invasion of the Pacific Northwest: California’s birds expand north with warmer winters looks at northward range expansions of Great Egret, Turkey Vulture, Red-shouldered Hawk, Anna’s Hummingbird, Black Phoebe, Townsend’s Warbler, and California Scrub-Jay, with some discussion of others as well. Note that Townsend’s Warbler, as a migrant that winters rarely in the PNW, fits with the group of birds described in this post.
The song of the Lesser Goldfinch: Another harbinger of a warming climate looks at increasing records in the PNW in summer.
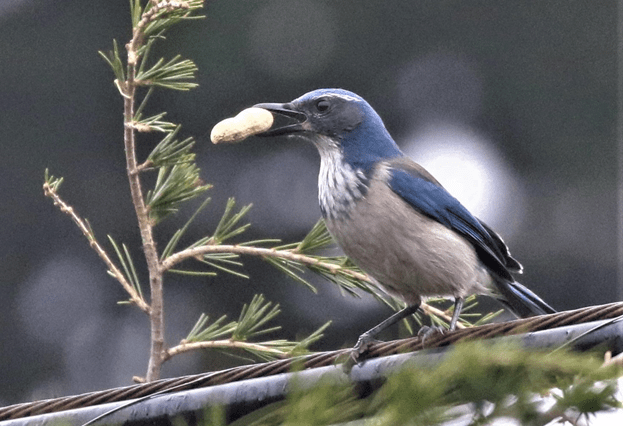
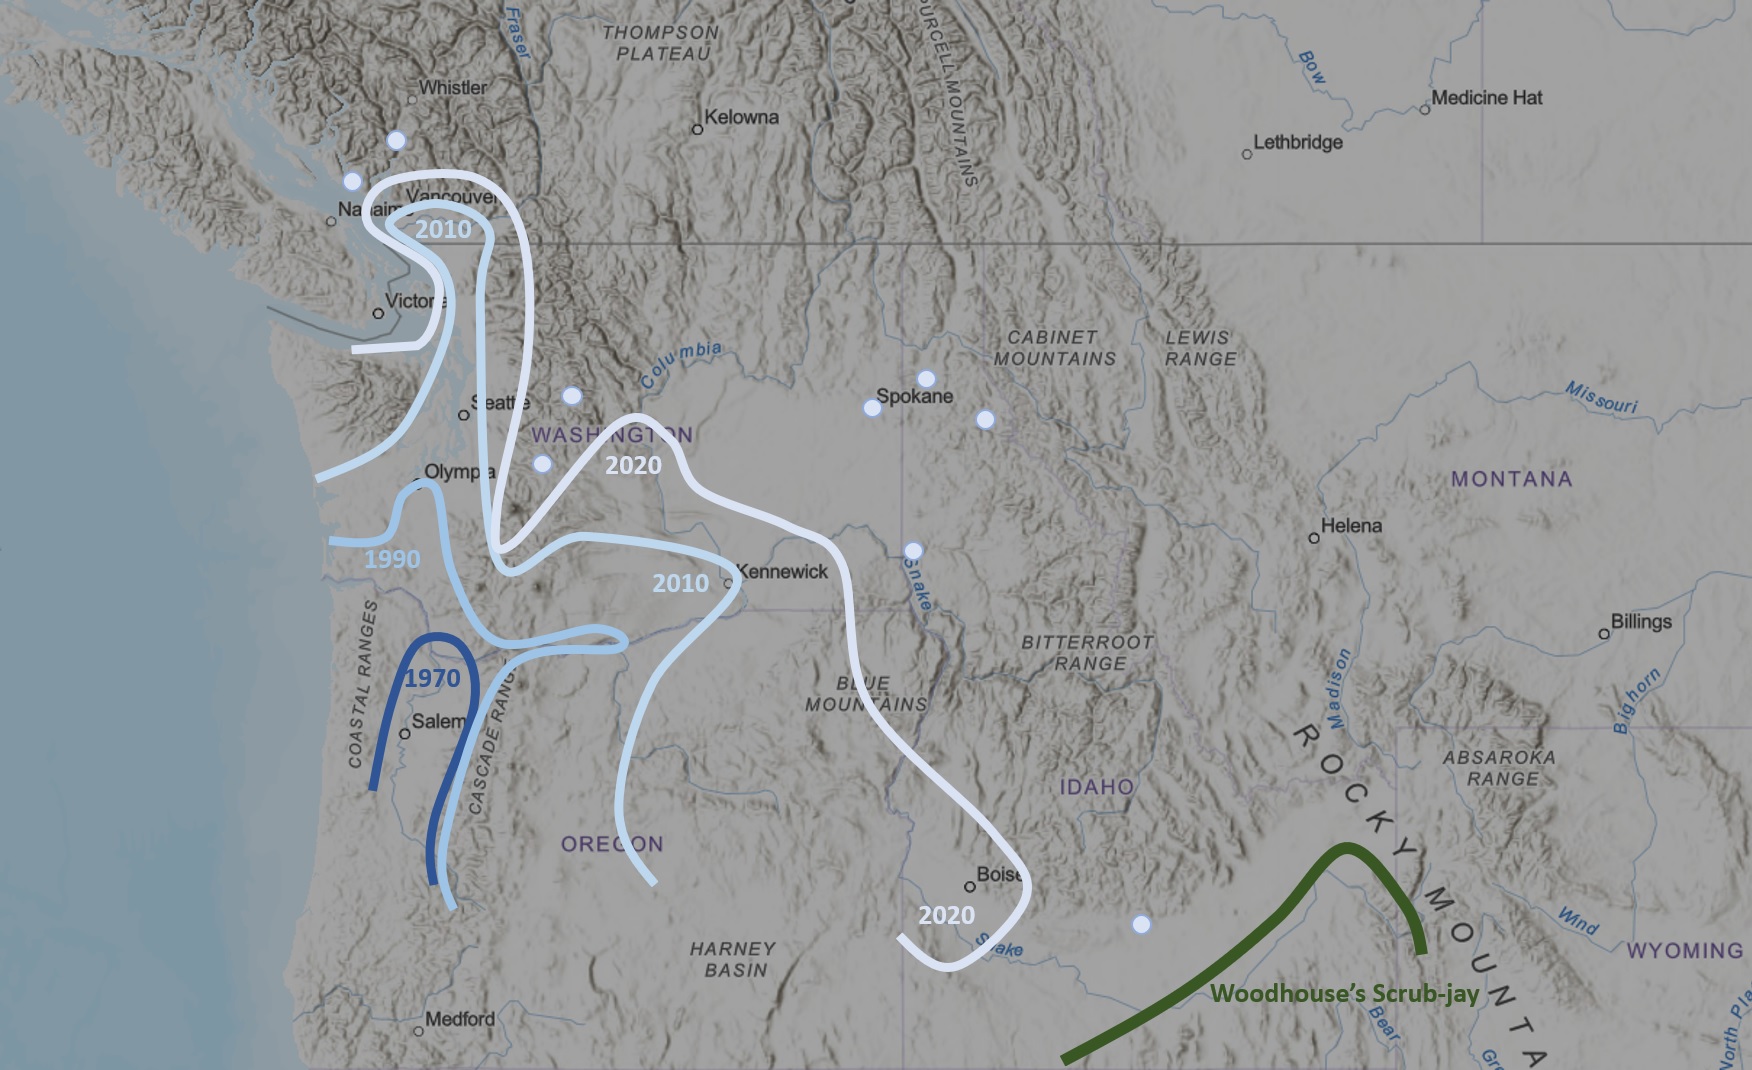
Mapping the expansion of the California Scrub-Jay into the Pacific Northwest looks at the steady range expansion of this non-migratory species.
References
Hampton, S. 2019. Avian responses to rapid climate change: Examples from the Putah Creek Christmas Bird Count. Central Valley Birds 22(4): 77-89.
Hitch and Leberg. 2007. Breeding distributions of North American bird species moving north as a result of climate change. Conservation Biology 21(2): 534-9.
Illán et al. 2014. Precipitation and winter temperature predict long-term range-scale abundance changes in Western North American birds. Global Change Biology, 20 (11), 3351–3364.
Langham et al 2015. Conservation status of North American birds in the face of future climate change. PLoS ONE 10(9): e0135350.
La Sorte, F.A., and F.R. Thompson III. 2007. Poleward shifts in winter ranges of North American birds. Ecology 88(7):1803–1812.
Paprocki et al. 2014. Regional Distribution Shifts Help Explain Local Changes in Wintering Raptor Abundance: Implications for Interpreting Population Trends. PLoS ONE 9(1): e86814.
Paprocki et al. 2017. Combining migration and wintering counts to enhance understanding of population change in a generalist raptor species, the North American Red-tailed Hawk. The Condor, 119 (1): 98–107.
Prince, K. and B. Zuckerberg. 2016. Climate change in our backyards: the reshuffling of North America’s winter bird communities. Global Change Biology 21(2): 572-585.
Saunders et al. 2022. Unraveling a century of global change impacts on winter bird distributions in the eastern United States. Global Change Biology
Virkkala, R. and A. Lehikoinen 2014. Patterns of climate-induced density shifts of species: poleward shifts faster in northern boreal birds than in southern birds. Global Change Biology 20: 2995–3003.
Wu et al. 2018. Projected avifaunal responses to climate change across the U.S. National Park System. PLOS ONE 13(3): e0190557.
I try to maintain an updated list of references at the Birds and Climate Change Facebook group. At that page, click on Files to find the list.


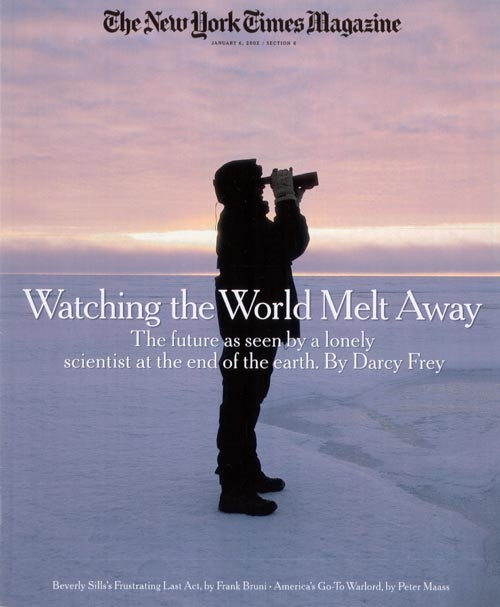 “Watching the World Melt Away: The future as seen by a lonely scientist at the end of the earth.” The article was about seabird biologist George Divoky and his decades of work studying the black guillemot, a high arctic seabird, on Cooper Island off the coast of Barrow, Alaska. The guillemots were struggling to feed their chicks. Their preferred food, Arctic cod, lived at the edge of the sea ice. In the past, this was five miles from the island. Now it was thirty. Divoky, moreover, found himself sharing his tiny island with several hungry polar bears stranded by the vast expanse of open water. At the time, the story was one of the first concrete examples of climate change impacting an ecosystem in way that was easily seen and understood.
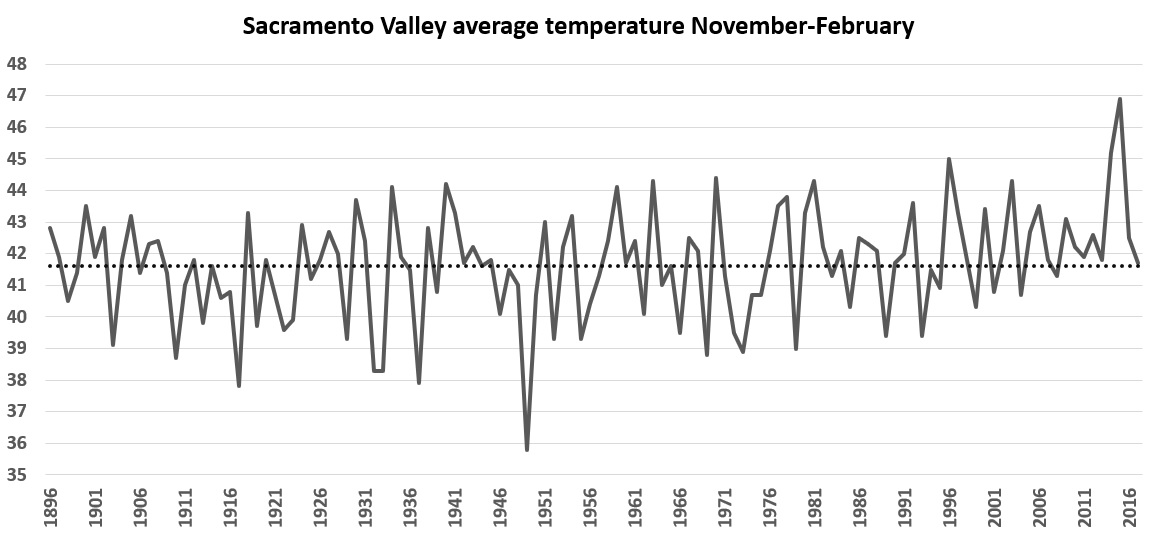
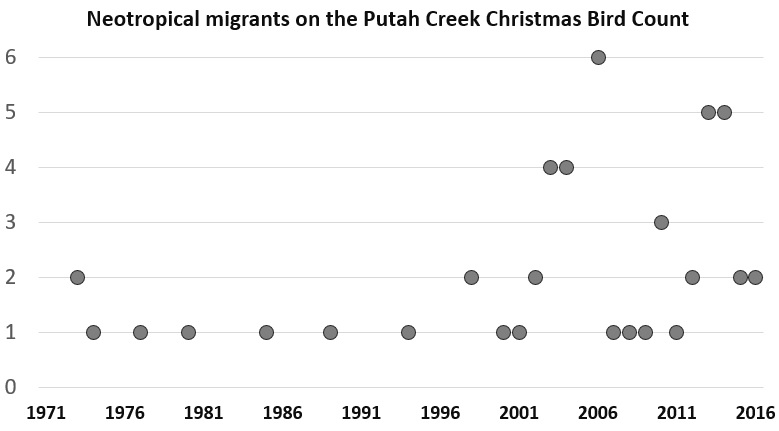 The Putah Creek Christmas Bird Count, an annual effort to count all the birds in a 15-mile diameter circle near Winters on one day each December, has tracked winter bird populations since 1971. In recent years, the number of neotropical migrants found on the count has swelled. These include warbling vireo and Wilson’s and Townsend’s warblers, in addition to the species mentioned above. Perhaps the most dramatic shift in the count data has been with the turkey vulture. With the absence of tule fog, these birds, which rely on warm thermals to give them some lift, have gone from sparse, rarely more than 15 birds on a count through 1985, to over 150 individuals per count in each of the past eight years.
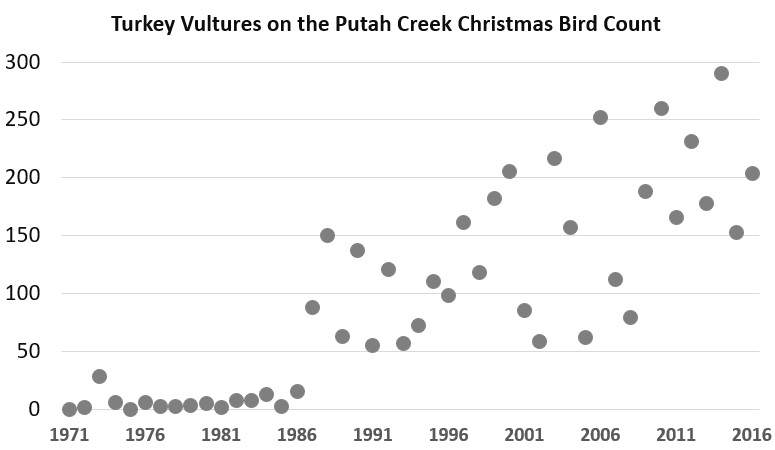 A warming climate is expected to create more increases than decreases in bird life in Yolo County. This is because species diversity is greatest in the tropics. As bird ranges shift north, we expect to see more arrivals than departures. Among the departures are some northern species that are growing scarcer in winter. Most notable is rough-legged hawk, a tundra species that journey south to agricultural areas to eat rodents in winter. They have, however, become decidedly hard to find in recent years, perhaps finding the Willamette Valley and other more northern valleys suitable for their wintering grounds. Another species to watch is the beautiful cedar waxwing, which descend on fruits and berries in the winter months. The more they can find food in the north, the less likely they will come this far south. They are erratic from year to year, however, so it is too early to identify a trend.