The international climate report in three diagrams: The world at a crossroads

On October 6, 2018, the Intergovernmental Panel on Climate Change (IPCC) issued its Special Report on Global Warming of 1.5 °C (known at “SR15”), looking at the benefits of keeping global warming under 1.5 °C, as compared to 2.0 °C, and the potential pathways to get there. The report was commissioned after the Paris Agreement of 2015, which subjected nearly every nation in the world to voluntary goals for reducing greenhouse gas emissions. We are already at 1.0 °C and climbing, so this is a late-in-the-game analysis.

The results, based on the latest science, are sobering. While past IPCC reports were known for being rather conservative, largely due to political pressure, this one is more direct, practically screaming for a radical reduction in fossil fuel use (which must fall to near zero by 2060 even with a technological breakthrough in carbon sequestration). When it was approved, participating scientists cried tears of joy that their report, dire as it is, was allowed to be published as it was.

The full report, a little over 1,000 pages, is available in chapters here.  It provides important details regarding the effects of climate change from region to region.

A 34-page summary for policy-makers is available here.

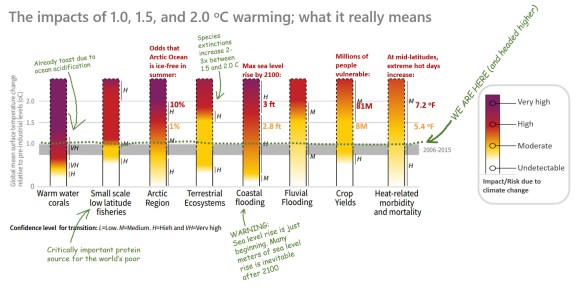
But even that summary is full of technical jargon that most politicians and members of the public would find cumbersome. Here I’ve taken some of the most important diagrams from the summary and modified and annotated them.  Here is the report in three diagrams:

[CLICK TO ENLARGE]

IPCC1


IPCC2


IPCC3


How to stop birds from flying into your windows

Window strikes kill hundreds of millions of birds each year. It’s a terrible feeling when you’ve set up a feeder just so you can watch the birds and it becomes a death trap, luring birds into food, only to be followed by a sharp “thunk” against your window, resulting in a stunned and sometimes dead bird.

1-2

My falcon decals look great from the inside, but they are nearly impossible to see from the outside. Since they don’t move, they don’t attract attention. They did little to stop window strikes.

Here I present one solution from my backyard. The key is something in front of the window that allows the birds to see it and realize what it is. Moving objects, like ribbons that move in the wind, work best. Still objects, like falcon decals and plastic owls, work poorly. Additionally, the maximum range of effect of a window marker is only about 18 inches. I’ve had birds hit my window within 18 inches of the falcon decoy.

Here is my solution, which is quite effective. Tack a shiny ribbon to the top middle of each window, hanging down most of the length of the window.  I had a name brand mylar ribbon designed for the purpose (probably a Father’s Day gift), but any shiny ribbon will probably work. There are other similar brands on Amazon. The key is that it moves in the slightest breeze, reflecting off and revealing the window behind it.

3-4

This 8-second video illustrates how the slightest wind moves the ribbons, making the windows apparent. Note the falcon decals are still there, just hard to see.

Finally, here’s a view from inside the house with the ribbons in place. From the inside, they are much less noticeable than the decals. From the outside, it’s a different story.

5

Another thing to experiment with is the placement of your feeders. I once hung a thistle feeder very near the windows. This resulted in several goldfinch deaths, as they tend to flush from the feeder in a fast direct flight. I moved the feeder back ten feet, which made a huge difference, apparently giving them time to see their options while flushing.

The 2018 flight of the Buff-breasted Sandpipers: Data from the West Coast

Buff-breasted Sandpipers breed on the Arctic tundra from western Alaska, across northern Canada, to Baffin Island. They winter eight thousand miles to the south, on the grasslands of the River Plate Basin in Argentina, Uruguay, and Paraguay. Their primary migration corridor is east of the Rockies, through the central United States. A secondary route is along the East Coast. They are always rare in fall migration along the West Coast, with four to fourteen individuals counted each fall between 2014 and 2017. In spring, they are almost unheard of (there is one record in eBird from Arcata, California in May, 1980).

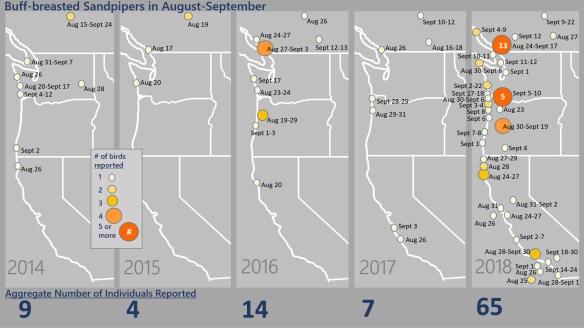
Fall migration in 2018 was exceptional on the West Coast, with sixty-five individuals reported, five to ten times the norm. The figure below summarizes eBird data from the past five years in southern British Columbia, Washington, Oregon, and California.

CLICK TO ENLARGE.

BBSA

A few interesting points:

  • While fall migration generally spans from mid-August thru late September, the timing of records within that period are not strongly correlated with latitude.  That is, it does not appear that birds are moving from north to south through the period. Each season’s latest records, from mid or late September, may come from British Columbia or Washington as easily as from southern California. That said, in 2018, the latest records are indeed from southern California. Moreover, the very few October records over the years (not included in the graph) are from southern California.
  • They are most reliable in the Pacific Northwest, only reaching California in years of relative abundance, such as 2018. The only location with records from every year is Salmon Arm Bay of Shuswap Lake, in the interior of British Columbia. Other sites, with records in all but one year, are Boundary Bay, British Columbia, and the south coast of Washington (e.g. Ocean Shores, Gray’s Harbor vicinity).
  • The vast majority of records are of single individuals. The only time more than four birds were documented together during these years was in 2018, with five birds at once at Sauvie Island, Oregon, and a remarkable thirteen at Boundary Bay.
  • In the years 2014-2017, Buff-breasted Sandpipers first appeared between August 15 and 19. In 2018, they did not appear until August 23, and most were relatively later than birds in previous years.
  • In 2018, there were several records from offshore California: one from the Farallons, two from San Clemente Island, and two birds seen together from a pelagic trip one hundred miles off southern California. These were all relatively early in migration, between August 25 and September 1. In contrast, most 2018 records from the Oregon coast were from the first week of September.