Over a year ago, on a webinar hosted by the Washington Ornithological Society (WOS), John Fitzpatrick of Cornell Lab of Ornithology teased us with some screenshots of eBird Trends maps. I was mesmerized. Now, they have been released here at the eBird Science tab. These remarkable maps illustrate population trends for each species across their range, showing exactly where they are increasing (blue dots) or decreasing (red dots).
They do more than that, actually. The color of the dot is correlated to the rate of change — the % change between 2007 and 2021. Dark blue means really increasing; dark red really declining. The size of each dot is correlated to the size of the population in that area (or “relative abundance” in eBird lingo). Big dots mean there’s a lot of birds there, regardless of whether they are increasing or decreasing. If you hover over a dot, the actual numbers pop up. White dots mean the data are inconclusive or show no trend. You can read more of the details at the site, and perhaps I’ll discuss methodology on a later post.
Here’s the amazing thing — each dot represents a 27 x 27 km (16.7 x 16.7 mile) grid square, so just a bit larger than a Christmas Bird Count circle, which are 15 miles in diameter. That’s a remarkable level of detail. I joke that there’s more information in these maps than in all the ornithological research in the last ten years. That’s an overstatement, of course, because professional ornithologists study things that eBirders don’t. Nevertheless, these maps take crowdsourced data collection and present it in ways that are instantly useful for understanding species population trends at a granular level. This has profound implications for targeting conservation.
So, on to my first of probably many posts looking at these maps. My first peruse suggests they strongly support what the climate change research has been saying — that resident and short-distance migrants are shifting their ranges north. Let’s start with some common eastern species.
CLICK TO ENLARGE

Until now, most of the published literature on northward range shifts have been meta-analyses with conclusions such as “non-migratory species are shifting north by so many km per year”, but no maps, nor even mention of species by name. Here, we get the details in bright colors, at the species and even county level. Wow.
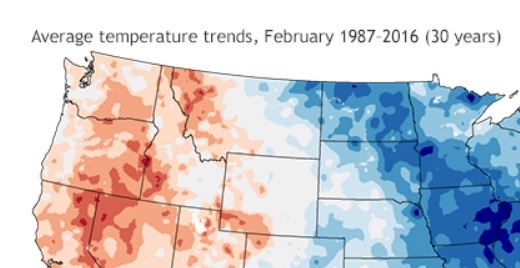
A few observations. For many species, they are declining where they are still common (the red dots are large), and increasing where they are less common or even rare (the blue dots are small). This probably implies that their overall population is declining. It also suggests that climate change may be hurting them in the south faster than it is helping them in the north. It takes time to establish new populations, and/or the new regions may not be as suitable as their old home. Note also that each of these species have different transition isoclines (if that’s what one would call it). For example, Red-bellied Woodpecker and Carolina Wren are increasing in Tennessee, but Tufted Titmouse are declining there.
Here are some relevant papers regarding range shifts in eastern species, but again, these maps communicate their results in new and vibrant ways:
Prince, K. and B. Zuckerberg. 2016. Climate change in our backyards: the reshuffling of North America’s winter bird communities. Global Change Biology 21(2): 572-585. We conclude that a shifting winter climate has provided an opportunity for smaller, southerly distributed species to colonize new regions and promote the formation of unique winter bird assemblages throughout eastern North America.
Rushing, C.S. et al. 2020. Migratory behavior and winter geography drive differential range shifts of eastern birds in response to recent climate change. Proceedings of the National Academy of Sciences, 117(23), pp.12897-12903. Since the early 1970s, species that remain in North America throughout the year, including both resident and migratory species, appear to have responded to climate change through both colonization of suitable area at the northern leading edge of their breeding distributions and adaption in place at the southern trailing edges.
Saunders et al. 2022. Unraveling a century of global change impacts on winter bird distributions in the eastern United States. Global Change Biology We conclude that climate has generally governed the winter occurrence of avifauna in space and time, while [habitat] change has played a pivotal role in driving distributional dynamics of species with limited and declining habitat availability.
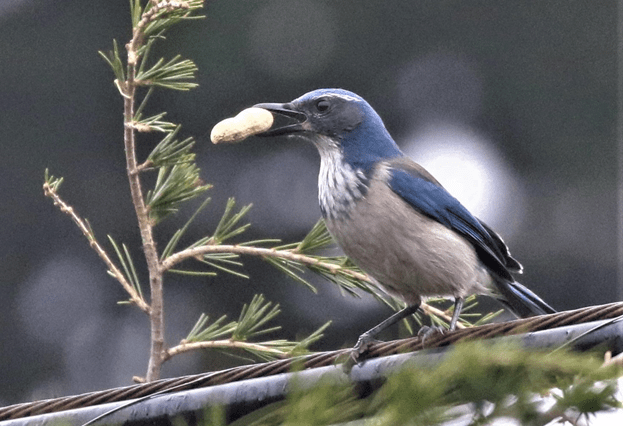
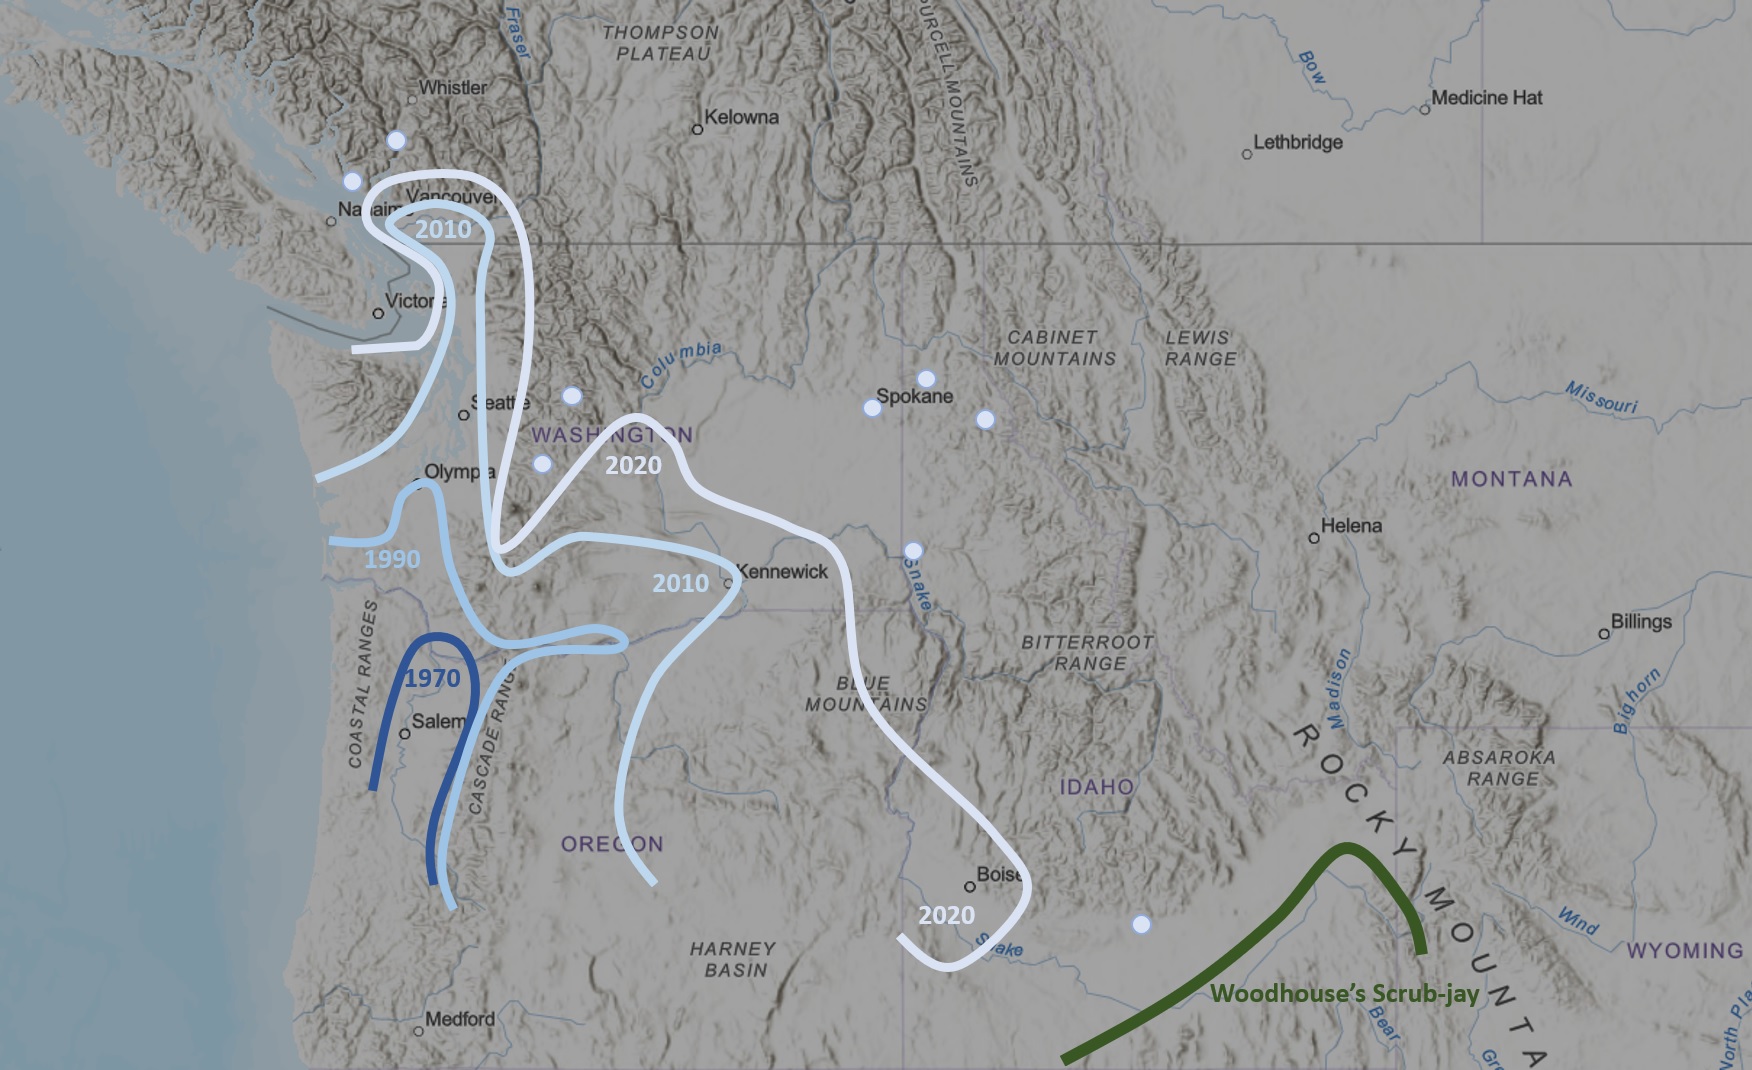
The maps also support some of my previous blog posts: such as the northward expansion of Northern Cardinal, Carolina Wren, Tufted Titmouse, and Red-bellied Woodpecker, the crash of Florida’s white-eyed Eastern Towhees, certain range expansions of the Lesser Goldfinch and California Scrub-Jay, the expansion of many species from California into the Pacific Northwest, and the failure of oak-dependent species (e.g. Oak Titmouse and Nuttall’s Woodpecker) to go anywhere.
In future posts, I’ll look at range shifts in resident birds of the West, the impact of California’s fires (many encompassing several of these Trends dots), long-distance migrants, nationwide species, waterbirds, and seabirds, among other things.