eBird Trends maps reveal dramatic northward range shifts in Eastern species

Over a year ago, on a webinar hosted by the Washington Ornithological Society (WOS), John Fitzpatrick of Cornell Lab of Ornithology teased us with some screenshots of eBird Trends maps. I was mesmerized. Now, they have been released here at the eBird Science tab. These remarkable maps illustrate population trends for each species across their range, showing exactly where they are increasing (blue dots) or decreasing (red dots).

They do more than that, actually. The color of the dot is correlated to the rate of change — the % change between 2007 and 2021. Dark blue means really increasing; dark red really declining. The size of each dot is correlated to the size of the population in that area (or “relative abundance” in eBird lingo). Big dots mean there’s a lot of birds there, regardless of whether they are increasing or decreasing. If you hover over a dot, the actual numbers pop up. White dots mean the data are inconclusive or show no trend. You can read more of the details at the site, and perhaps I’ll discuss methodology on a later post.

Here’s the amazing thing — each dot represents a 27 x 27 km (16.7 x 16.7 mile) grid square, so just a bit larger than a Christmas Bird Count circle, which are 15 miles in diameter. That’s a remarkable level of detail. I joke that there’s more information in these maps than in all the ornithological research in the last ten years. That’s an overstatement, of course, because professional ornithologists study things that eBirders don’t. Nevertheless, these maps take crowdsourced data collection and present it in ways that are instantly useful for understanding species population trends at a granular level. This has profound implications for targeting conservation.

So, on to my first of probably many posts looking at these maps. My first peruse suggests they strongly support what the climate change research has been saying — that resident and short-distance migrants are shifting their ranges north. Let’s start with some common eastern species.

CLICK TO ENLARGE
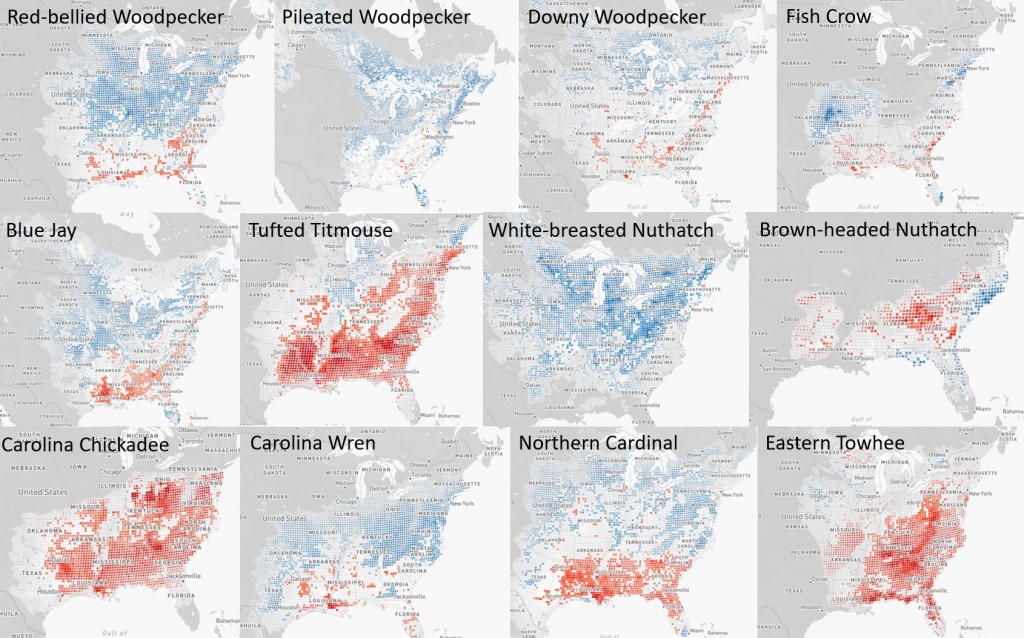
To examine each map in detail, go to eBird’s Trends page, type in the species name, and then click “Trends” to the right of the species’ name.

Until now, most of the published literature on northward range shifts have been meta-analyses with conclusions such as “non-migratory species are shifting north by so many km per year”, but no maps, nor even mention of species by name. Here, we get the details in bright colors, at the species and even county level. Wow.

A few observations. For many species, they are declining where they are still common (the red dots are large), and increasing where they are less common or even rare (the blue dots are small). This probably implies that their overall population is declining. It also suggests that climate change may be hurting them in the south faster than it is helping them in the north. It takes time to establish new populations, and/or the new regions may not be as suitable as their old home. Note also that each of these species have different transition isoclines (if that’s what one would call it). For example, Red-bellied Woodpecker and Carolina Wren are increasing in Tennessee, but Tufted Titmouse are declining there.

Here are some relevant papers regarding range shifts in eastern species, but again, these maps communicate their results in new and vibrant ways:

Prince, K. and B. Zuckerberg. 2016. Climate change in our backyards: the reshuffling of North America’s winter bird communities. Global Change Biology 21(2): 572-585. We conclude that a shifting winter climate has provided an opportunity for smaller, southerly distributed species to colonize new regions and promote the formation of unique winter bird assemblages throughout eastern North America.

Rushing, C.S. et al. 2020. Migratory behavior and winter geography drive differential range shifts of eastern birds in response to recent climate change. Proceedings of the National Academy of Sciences117(23), pp.12897-12903. Since the early 1970s, species that remain in North America throughout the year, including both resident and migratory species, appear to have responded to climate change through both colonization of suitable area at the northern leading edge of their breeding distributions and adaption in place at the southern trailing edges.

Saunders et al. 2022. Unraveling a century of global change impacts on winter bird distributions in the eastern United States. Global Change Biology We conclude that climate has generally governed the winter occurrence of avifauna in space and time, while [habitat] change has played a pivotal role in driving distributional dynamics of species with limited and declining habitat availability.

The maps also support some of my previous blog posts: such as the northward expansion of Northern Cardinal, Carolina Wren, Tufted Titmouse, and Red-bellied Woodpecker, the crash of Florida’s white-eyed Eastern Towhees, certain range expansions of the Lesser Goldfinch and California Scrub-Jay, the expansion of many species from California into the Pacific Northwest, and the failure of oak-dependent species (e.g. Oak Titmouse and Nuttall’s Woodpecker) to go anywhere.

In future posts, I’ll look at range shifts in resident birds of the West, the impact of California’s fires (many encompassing several of these Trends dots), long-distance migrants, nationwide species, waterbirds, and seabirds, among other things.

Northward expansion of Northern Cardinal, Carolina Wren, Tufted Titmouse, and Red-bellied Woodpecker

A number of recent academic papers have described northward shifts of bird species in both North America and Europe, driven by climate change. These papers usually present aggregated results from dozens of species; they rarely provide details for any specific species. These maps are intended to offer that.

While there are tremendous species-specific differences, non-migratory resident birds (such as Northern Cardinal, Carolina Wren, Tufted Titmouse, and Red-bellied Woodpecker) appear to be the most adaptable and have expanded their ranges the most. This seems to be primarily driven by warmer winters and, for some species, is further augmented by bird feeders.

I created these maps using eBird, so the usual caveats apply– they don’t necessarily include all records (though many historical out-of-range records are indeed included), and eBird reporting, which became widespread only after 2010, continues to increase dramatically each year. To draw the lines, my intent was to capture the primary range area — and more — but I deliberately excluded the furthest ten to fifteen outliers for each line.

CLICK TO ENLARGE GRAPHICS

Northern Cardinals (once called Kentucky Cardinals) have been expanding north for decades, but have increased their rate.
Carolina Wren is a classic example of a species knocked back by harsh winters, finding some refuge around bird feeders, and then continuing to expand in warmer winters. See a graph of this at my previous post here.
Like many species, Tufted Titmouse has especially expanded northeast up the St. Lawrence River corridor.
To get a feel for what this expansion actually looks like in one place, see the graphs below from Christmas Bird Counts. Similar graphs could be made for all of these species.

For some examples of western species expanding north from California and southern Oregon into the Pacific Northwest, see this post: The invasion of the Pacific Northwest: California’s birds expand north with warmer winters.

I invite you to join the Facebook group dedicated to this topic: Birds and Climate Change.

Two of the academic papers that report climate-driven range expansions in eastern North America are listed below, along with their abstracts.

Prince, K. and B. Zuckerberg. 2016. Climate change in our backyards: the reshuffling of North America’s winter bird communities. Global Change Biology 21(2): 572-585.

Much of the recent changes in North American climate have occurred during the winter months, and as result, overwintering birds represent important sentinels of anthropogenic climate change. While there is mounting evidence that bird populations are responding to a warming climate (e.g., poleward shifts) questions remain as to whether these species-specific responses are resulting in community-wide changes. Here, we test the hypothesis that a changing winter climate should favor the formation of winter bird communities dominated by warm-adapted species. To do this, we quantified changes in community composition using a functional index–the Community Temperature Index (CTI)–which measures the balance between low- and high-temperature dwelling species in a community. Using data from Project FeederWatch, an international citizen science program, we quantified spatiotemporal changes in winter bird communities (n = 38 bird species) across eastern North America and tested the influence of changes in winter minimum temperature over a 22-year period. We implemented a jackknife analysis to identify those species most influential in driving changes at the community level and the population dynamics (e.g., extinction or colonization) responsible for these community changes. Since 1990, we found that the winter bird community structure has changed with communities increasingly composed of warm-adapted species. This reshuffling of winter bird communities was strongest in southerly latitudes and driven primarily by local increases in abundance and regional patterns of colonization by southerly birds. CTI tracked patterns of changing winter temperature at different temporal scales ranging from 1 to 35 years. We conclude that a shifting winter climate has provided an opportunity for smaller, southerly distributed species to colonize new regions and promote the formation of unique winter bird assemblages throughout eastern North America.

Saunders et al. 2022. Unraveling a century of global change impacts on winter bird distributions in the eastern United States. Global Change Biology

One of the most pressing questions in ecology and conservation centers on disentangling the relative impacts of concurrent global change drivers, climate and land-use/land-cover (LULC), on biodiversity. Yet studies that evaluate the effects of both drivers on species’ winter distributions remain scarce, hampering our ability to develop full-annual-cycle conservation strategies. Additionally, understanding how groups of species differentially respond to climate versus LULC change is vital for efforts to enhance bird community resilience to future environmental change. We analyzed long-term changes in winter occurrence of 89 species across nine bird groups over a 90-year period within the eastern United States using Audubon Christmas Bird Count (CBC) data. We estimated variation in occurrence probability of each group as a function of spatial and temporal variation in winter climate (minimum temperature, cumulative precipitation) and LULC (proportion of group-specific and anthropogenic habitats within CBC circle). We reveal that spatial variation in bird occurrence probability was consistently explained by climate across all nine species groups. Conversely, LULC change explained more than twice the temporal variation (i.e., decadal changes) in bird occurrence probability than climate change on average across groups. This pattern was largely driven by habitat-constrained species (e.g., grassland birds, waterbirds), whereas decadal changes in occurrence probabilities of habitat-unconstrained species (e.g., forest passerines, mixed habitat birds) were equally explained by both climate and LULC changes over the last century. We conclude that climate has generally governed the winter occurrence of avifauna in space and time, while LULC change has played a pivotal role in driving distributional dynamics of species with limited and declining habitat availability. Effective land management will be critical for improving species’ resilience to climate change, especially during a season of relative resource scarcity and critical energetic trade-offs.

Carolina Wren + Climate Change vs the Polar Vortex

Like so many species, the Carolina Wren is expanding northward. And, like many of those species, this expansion started decades ago, before any measurable climate change, but has exploded in the past decades with climate change.

This phenomenon is most obvious – and even dramatic – among non-migratory species and short-distance migrants. The same thing is happening in the West (e.g. Anna’s Hummingbird, Turkey Vulture, Red-shouldered Hawk, Great Egret, California Scrub-Jay, Black Phoebe, Townsend’s Warbler, and others).

The Carolina Wren has been expanding north since the 1800s due to habitat recovery after deforestation (Haggerty and Morton, 2020 – the Birds of North America (BNA) species account). What makes the recent Carolina Wren data so interesting is that we can clearly see, in its expansion into Canada, its battle with winter weather conditions.

The raw number of Carolina Wrens reported on Christmas Bird Counts in Canada. Over 95% of these come from southern Ontario. The cold waves marked on the graph were particularly record-breaking and long-lasting.

The species is known for “decimation… by severe winter conditions” (BNA) at the northern limits of its range. The same account notes that “severe winters have apparently been infrequent enough during the 20th century to allow populations to expand and move northward.” Indeed, one of the key conclusions of an analysis of climate change in southern Ontario was that there has been “a decrease in the frequency of cold temperature extremes”.  While the wren is aided against cold snaps by bird feeders, the climate trend, at least in Canada, is in its favor. The report noted an overall average increase of 1.5C.

eBird abundance map. The Carolina Wren has primarily been a species of edge habitat associated with moist southern forests.

As the wren expanded, certain record-breaking and persistent cold waves knocked the population back, where it restarted. It’s also clear that it is restarting from a higher position each time, thus building its numbers and continuing its expansion.

The cold snaps denoted on the graph were particularly severe in southern Ontario. A more detailed look at weather data may reveal a more complicated pattern and even greater correlation to warmer winters.

Predicted range changes for Carolina Wren by National Audubon under 1.5C scenario. This map is fairly accurate as the bird continues to colonize the St. Lawrence River corridor.
eBird map for December 2021 showing colonization from Toronto to Ottawa and Montreal and nearly to Quebec City.
A Carolina Wren fluffed up against the cold. Pic from National Audubon website.