Unknown's avatar

About Stephen Carr Hampton

Stephen Carr Hampton is an enrolled citizen of Cherokee Nation, an avid birder since age 7, and a former resource economist for the California Department of Fish & Game, where he worked as a tribal liaison and conducted natural resource damage assessments and oversaw environmental restoration projects after oil spills. He writes most often about Native history and contemporary issues, birds, and climate change.

Gull Identification in Puget Sound

Whether you want to nerd out on gull molt or argue over Olympic vs Glaucous-winged Gull criteria, this is your one-stop shop. This is my primer on gull identification and frequency in Puget Sound, from the perspective of Port Townsend. Most of these pics are from Port Townsend or elsewhere on the Olympic Peninsula, though a few are from farther afield.

I present them roughly in order of abundance. I start with the forms I see in numbers at various times through the year: Olympic, California, Short-billed, Heermann’s, and Bonaparte’s.

Then I move onto others I see in small numbers: Glaucous-winged, Ring-billed, Thayer’s Iceland, and Herring.

These regularly-occurring forms can practically be identified by bill, head, and body shape. These are all first cycle birds here. A word of caution: there is some variability in bill shape – and it can really change from one still photo to another based on angle and lighting. Also, male gulls are 15-20% larger than females, so size can be a moving target.

Finally, I cover some I rarely see: Western, Cook Inlet, and Glaucous.  

Gulls take several years to reach adulthood – three for the smaller gulls, four for the larger ones. During this time, they molt and fade and molt and fade. Season is everything. Gull identification in fall, when the birds are fresh and crisp, is completely different from spring and summer, when they are a faded, tattered mess. With each of these taxa, I’ll present the photos in order of age, so we’ll follow them as they age thru the months and thru the years.

Western x Glaucous-winged Gull (“Olympic Gull”)

Let’s start with the most common gull year-round – by far (with a few exceptions as noted below). When I’m birding, my default position is that all large gulls are Olympics until proven otherwise. (Personal shoutout to Shonn Morris for educating me about Olympic vs Glaucous-winged identification.) The nickname Olympic Gull was possibly first coined by Bob Boekelheide on a Tweeters post on January 13, 1997. Puget Sound Gull was another term batted about at the time.

Hybridization between these two species has been documented since 1908. A nice summary of the early observations, entirely on the outer coast from British Columbia to Oregon, can be found in Scott (1971). Bell’s thesis in 1992 described “a broad zone of introgression” from Haida Gwaii to Coos Bay. The colony at Protection Island, just around the corner from Port Townsend, has been described as the largest Olympic Gull colony in the world (Megna et al 2014). As described in that paper (see Figure 2 at right), the gulls in Puget Sound are decidedly toward the Glaucous-winged end of the spectrum, and “few individuals” appear to be pure Glaucous-winged. Note this is base on appearance, not DNA testing. This implies a hybrid swarm that has been going on for many generations. We are way past F1 hybrids. We’re more at F50 or more. In this context, Megna et al found evidence of assortative mating, meaning that paler birds were more likely to mate with paler birds, and darker birds with darker birds.

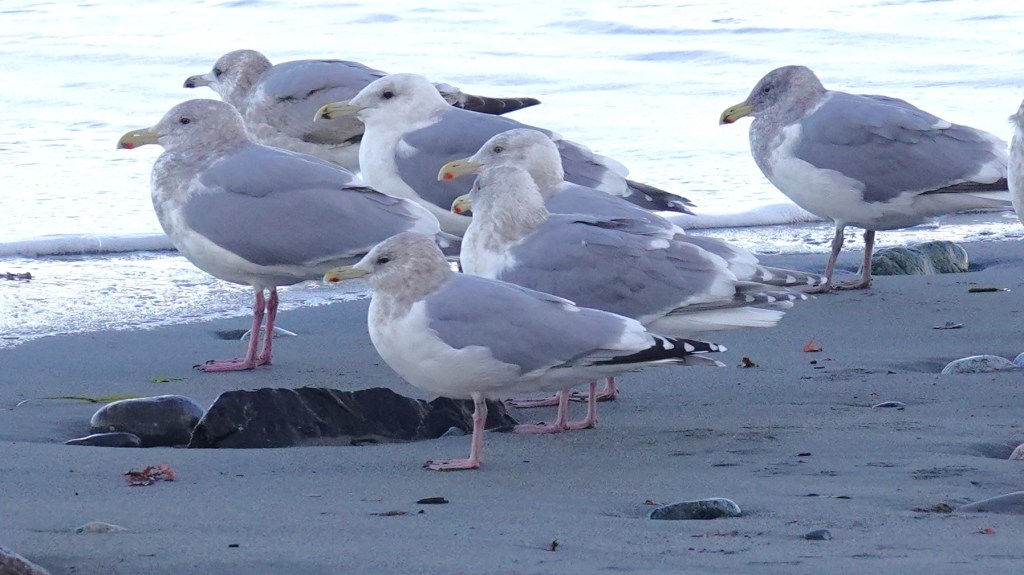
In my experience, and in keeping with Megna’s observations at Protection Island, most of the large gulls in Puget Sound (over 90%) appear to be hybrids at the Glaucous-winged end of the spectrum. That is my default assumption when using eBird. For those not comfortable with that, eBird also offers the option of “Western/Glaucous-winged Gull,” meaning the bird could be either parent species or a hybrid between the two; it’s the catch-all option. Simply calling dozens or even hundreds of birds “Glaucous-winged Gulls” is not correct, though that practice is widespread. That said, my limited observations in the San Juan Islands and Victoria, BC suggest less Western influence up there.

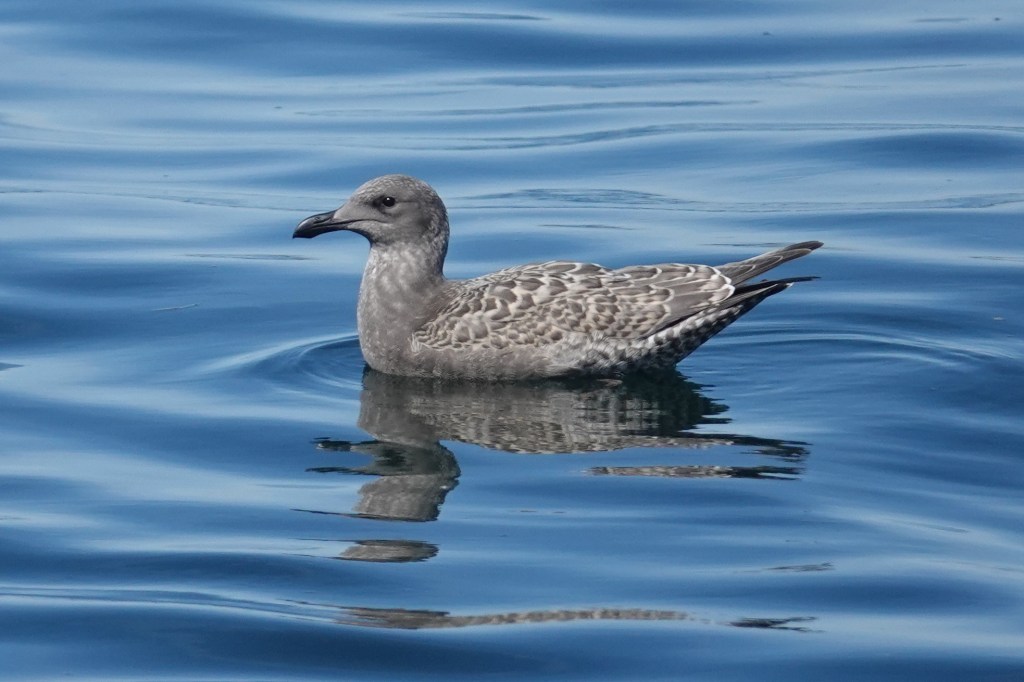
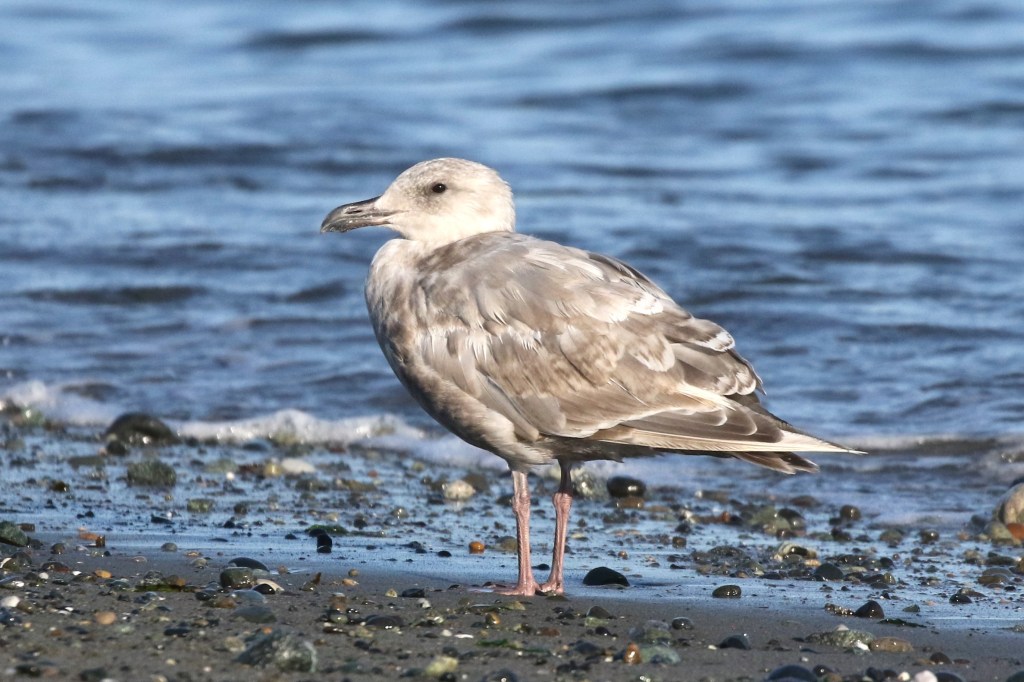
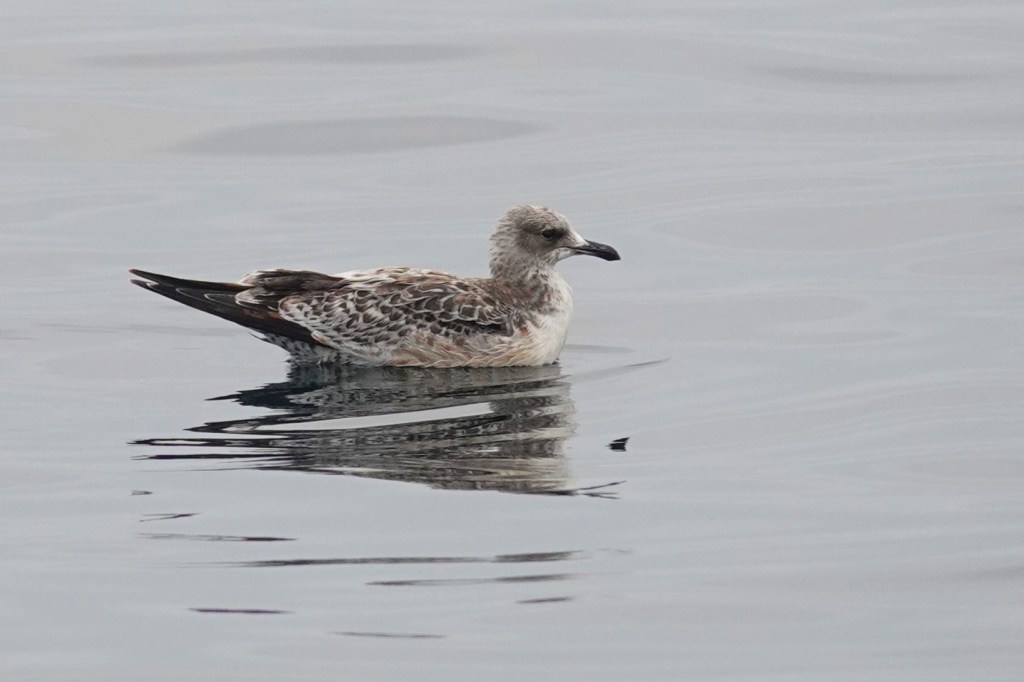
Aug 15 – Mid-August is when the first juveniles descend from the rooftops and appear on the beaches. They are crisp, with uniform brown-gray scaled scapulars and coverts. Their primaries are not jet black as in Western, Herring, California, and most other dark-winged gulls; they are dark gray. The color tone of the wing tips varies, as does the darkness of the entire bird. Like Western, the face has a uniform sooty auricular (cheek) patch, and the bill is black, large, and with a bulbous tip (see the head shots above).

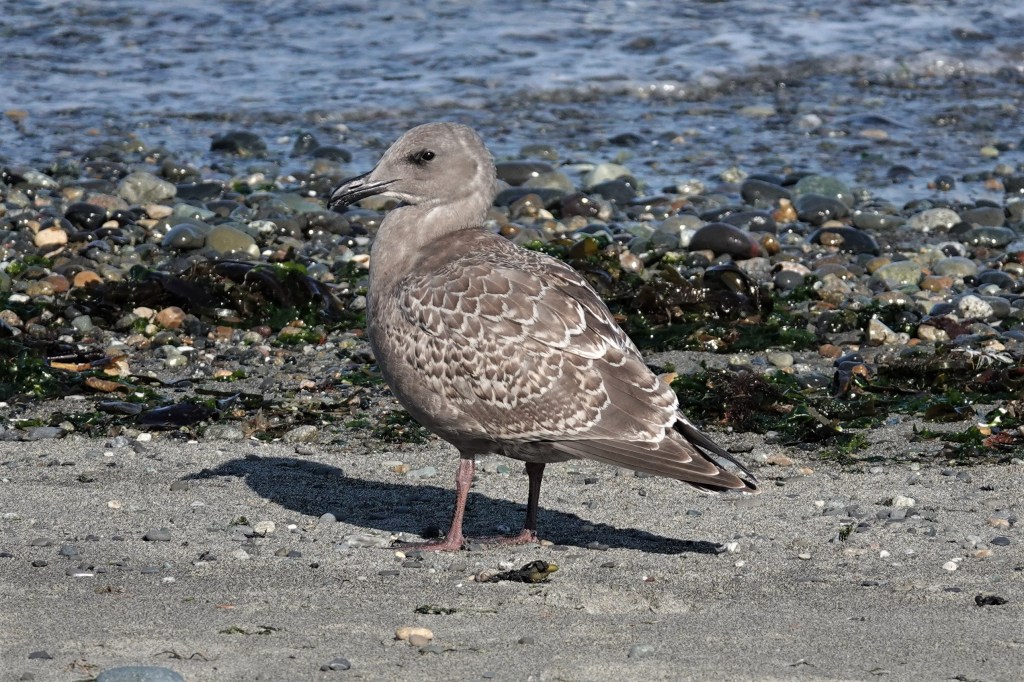
Sept 18 – A month later and they haven’t changed much. This one is a bit paler and browner, which could be a function of sun exposure as well. The scapular pattern varies a bit. Note the overall robust and stocky structure, with short primary extension past the tail (i.e. short wings).

Sept 18 – Here’s another example from the same day. This one has a nearly pale greater covert panel. California Gulls in the background.

Sept 24 – A delightfully coffee-cream version, very Thayer’s-like in appearance. However, the heavy bill, stocky structure, tiny eye on a large head, and short primaries rule out the more sleek and dainty Thayer’s.

Oct 4 – Changes are afoot. It’s October and the juveniles are already molting. The telltale sign are the molting scapulars (the back). (These are actually 1st alternate scaps which they will keep a long time.) Note that the upper half of the brown checkered feathers have been replaced by rather messy patterned ones with some gray tones. Also the head and body are molting in paler feathers, though the sooty cheek remains.

On the right-hand edge of the pic, you’ll see a second cycle bird with a pure white primary sticking out (what’s left of it). This old feather is being replaced by a fresh dark (nearly black) primary. More on that as we move thru the calendar.

Oct 11 – The molting back and scapulars are obvious here as a pale gray-blue patch on the bird’s back. This bird has neat oak-leaf patterned scapulars (very Herring like, though these are rather pale), but they will be molting out soon.
Some may be tempted to call this one Glaucous-winged, as it is paler, less sooty gray, overall, and the primaries are nearly concolorous to the body. Yet the overall darkness, the dark belly, and dark auriculars suggest Western influence.
That’s a 3rd cycle bird in the back. Note the primaries are obviously darker than the mantle.

Nov 1 – This darker bird has completely molted its back and scapulars.

Nov 1 – This bird is more delayed in its molt cycle; it still has a lot of checkered juvenile scapulars. All the birds in this pic appear to be Olympics.

Nov 12 – Some more late fall examples with molted back and scapulars. How dark or light they appear can change with light and the angle of the bird. These birds are definitely reflecting some sunlight.

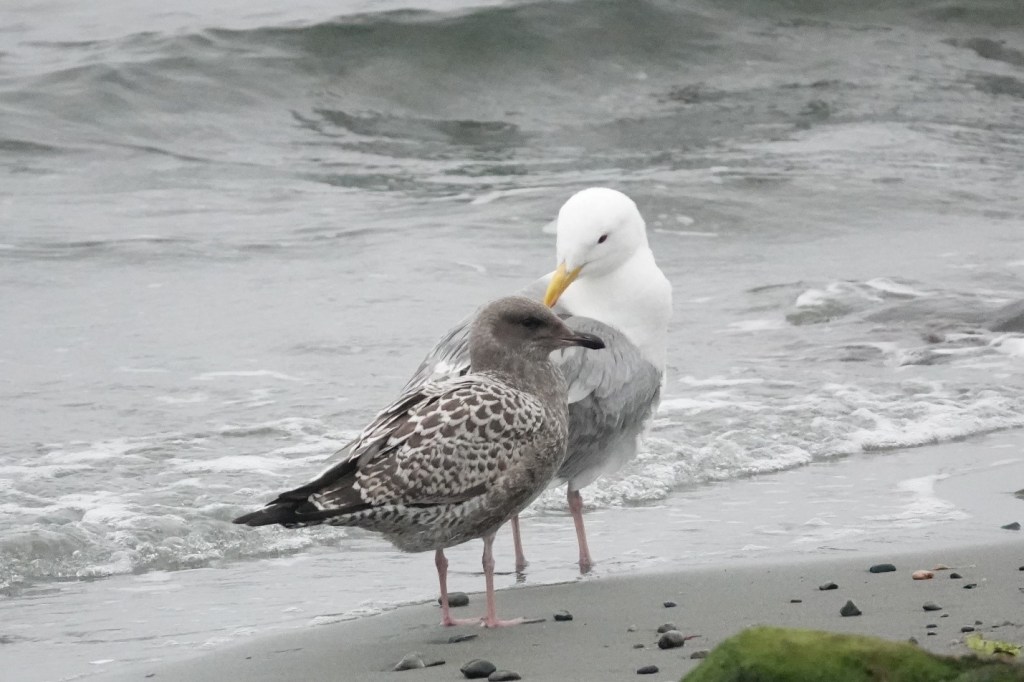
June 8 – And now we’re in June. Gull identification in spring and summer is a mess because the birds get quite faded and tattered. Exhibit A in this is the late 1st cycle bird on the right. This bird is now about 10 months old and desperately in need of molting to replace these primaries, which have now faded to nearly white. But that does not make it a Glaucous-winged Gull (same for the adult behind it). The rest of the bird, particularly the face and belly, are still rather dark.

June 23 – Another formerly sooty 1st cycle bird that looks like it’s gone through the wash.

June 23 – As summer wears on, many Olympics will have tertials and primaries that fade to white. This happens even in some dark-winged gulls (e.g. Short-billed). This bird has many Glaucous-winged features, though the dark below and large bulbous bill suggest some Western influence.

July 3 – With birds like this, it becomes impossible to use plumage to separate them from pure Glaucous-winged. The heavy bill with a rather sharp hook and gonydeal bulge are a better fit for Olympic.

July 6 – Here’s another summer bird that is a bit darker, and thus more obviously an Olympic. The exposed primary has a dark shadow on it where it was once covered by another feather.

July 8 – More examples of faded summery Olympics. Note the heavy dark bills and dark bellies.

July 12 – At last, molt has begun. They molt their secondaries and primaries from the inside out. The fresh feathers here are more gray; the old feathers more brown. The old primaries – the last three or four feathers on each wing – are also warn to pin points. Note, on the left wing, the new dark-tipped primary starting to grown in. This is P5 (the 5th one in from the tip, which is P10).

July 12 – A close-up look at P5 coming in.

July 14 – Another individual molting in fresh gray primaries to replace the tattered faded ones.

July 25 – And another individual. Even this rather dark-faced bird had its primaries fade to white. The new one is dark gray.

July 27 – Finding molting birds like this in late summer is fun. This bird is in the process of changing from a white-winged gull (which some might confused with Glaucous) to a nearly black-winged gull (approaching Western)!

July 27 – Taken on the same day as above, this bird is much slower in its molt cycle.

July 30 – Another bird molting from white-winged to dark-winged.

Sept 27 – September again. This bird is now a year and a few months old. It still has one long thin old faded white primary left. It’s new 2nd cycle primaries are dark enough to clearly put this bird in the Olympic camp.

Oct 4 – Another individual with a single white primary left, but new dark gray ones coming it. The other birds are juvenile Olympics, just a few months old.

Oct 11 – And voila, a fully molted fresh 2nd cycle Olympic Gull, ready for the winter.

June 8 – Now approaching it’s third birthday, this late 2nd cycle bird is ready for molt again. Note the bill had changed from black to incorporate the classic school bus yellow of Western.

Sept 20 – A juvenile begs from its parent. You can tell this adult is an Olympic because it’s child is an Olympic (with rather dark primaries). The adult has some faded primaries which are being replaced by a feather with a much darker gray band.

Oct 26 – A fully molted adult with dark gray in the primary pattern.

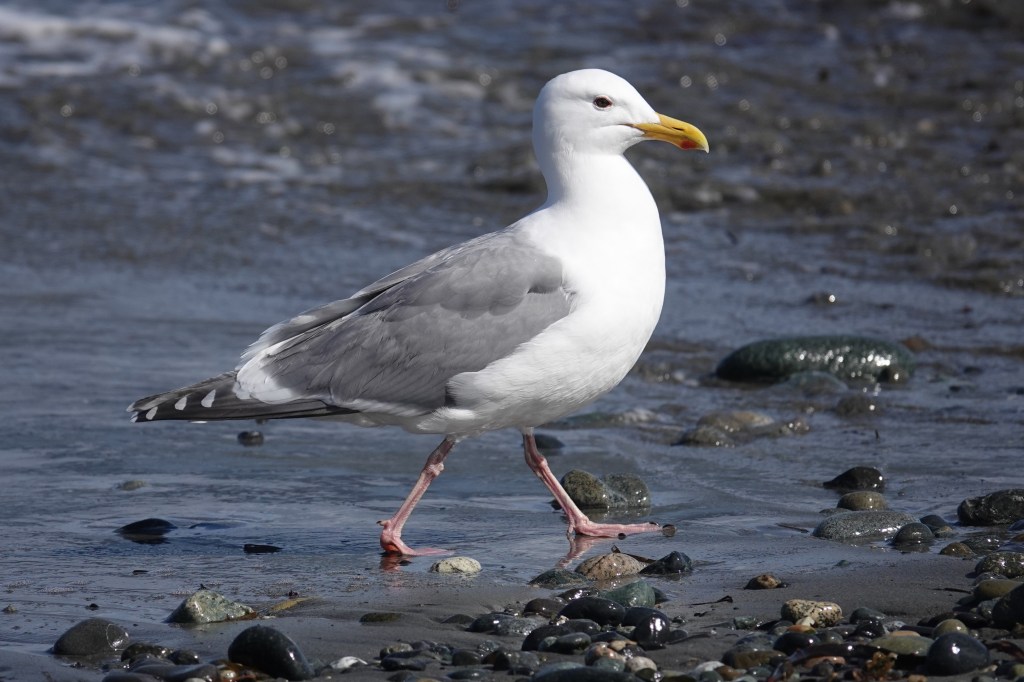
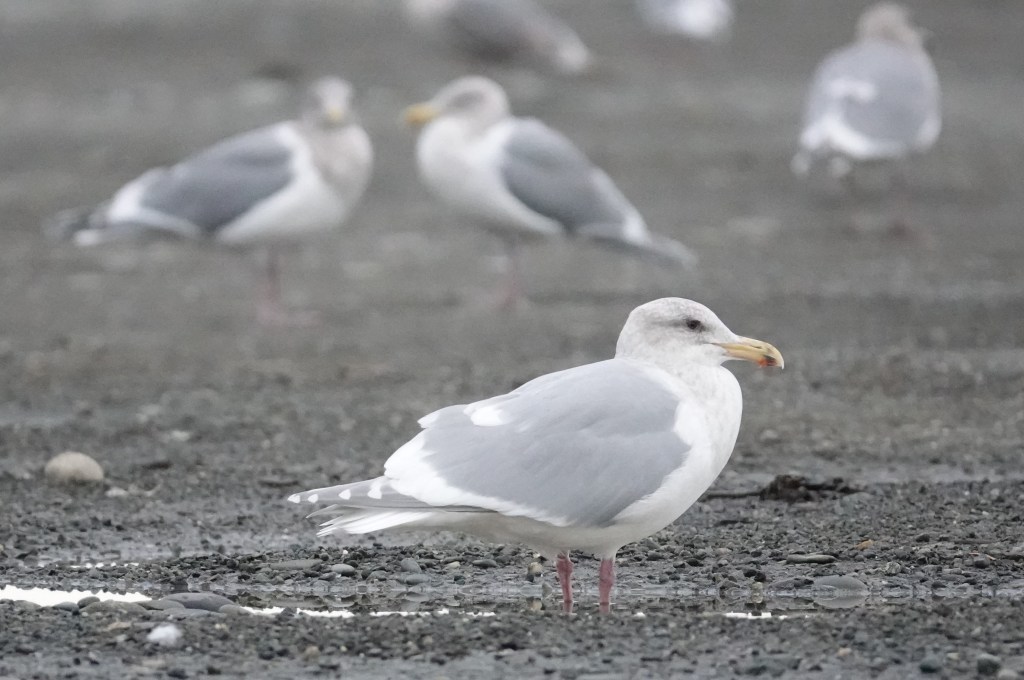
Jan 17 – Some more adult mid-winter. While the front right bird has rather medium gray primaries, only a little darker than the mantle, note the bill lacks any dark mark (as seen in the bird to the left), which Glaucous-winged should show in winter. The clean yellow bill is a Western feature.

Feb 17 – Thanks to David Estroff for this photo from Port Townsend. This is not a pure Western Gull because: 1) the underside of P10 (the folded wingtip in the back) is not black, but a silvery gray, especially on the inside of the white mirror. In a pure Western, this would be nearly black. 2) the orbital ring is reddish. In pure Western, it should be mustard yellow. Pure Western Gulls are rare in Puget Sound. I usually encounter them after strong west winds in winter. The clean white head is because it’s coming into breeding plumage.

Apr 19 – This adult is in full breeding plumage. When breeding, the bill and legs get brighter and more colorful. Note the primaries are too dark for Glaucous-winged, but too light for Western.

California Gull

California Gulls are abundant in Puget Sound June thru October, when a wave of post-breeding migrants pulse through the region. Especially in the Strait of Juan de Fuca, they can outnumber all other species combined in late summer. They can be found at other times of the year, though in much smaller numbers.

June 29 – I love it when the first juv Calis show up – little checkered gems on the kelp-covered cobble. They are typically rather skittish, so hard to get close pics. This June bird is my earliest record; usually they show up around July 11. Olympic in the foreground.

July 16 – Here’s another one among the Heermann’s, compared to which they are only slightly larger.

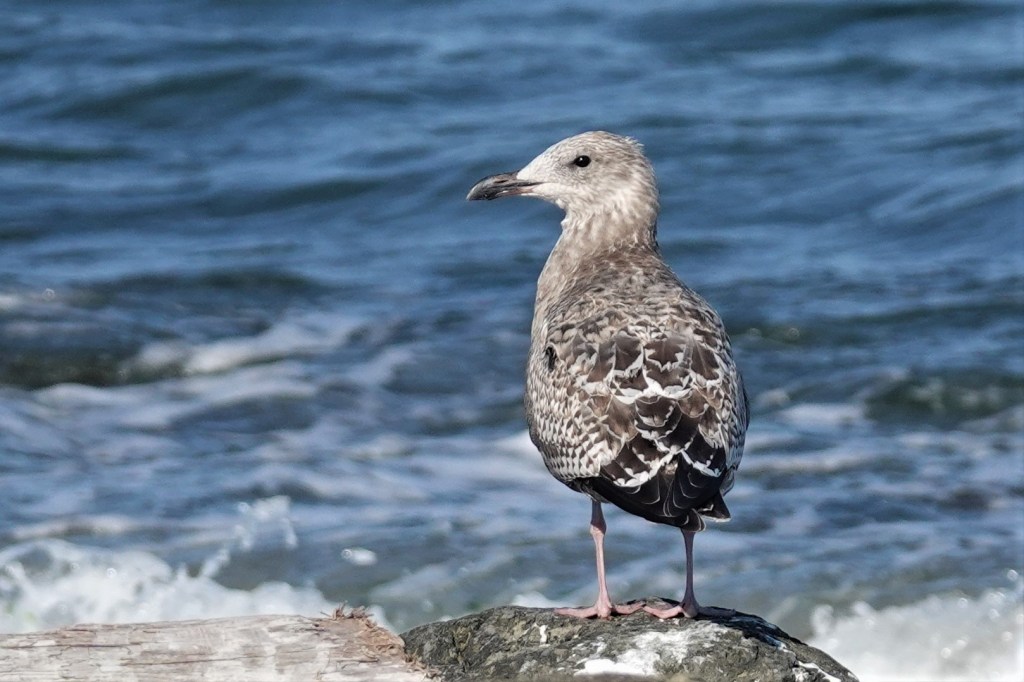
July 25 – Juvenile California Gulls can be confusing because many have all black bills. This one is already turning pale at the base. Compared to Olympic, note the long primary projection past the tail, the jet black primaries (blacker than any Olympic), and more horizontal and sleek posture.

July 27 – Two different juvenile California Gulls, now with the more characteristic dirty pink bill with black tip.

Aug 9 – These birds can look like juvenile Herring (which aren’t expected for another two months), but note the solid dark inner primaries, lacking a pale inner primary window.

Aug 27 – Though they vary from dark to light, this is a very typical juvenile California Gull.

Aug 27 – Taken on the same day as the previous pic, this is what is colloquially called a “cinnamon morph,” rather pale juvs with warm brown tones and whitish underparts. Given the all black bill, it must be quite young as well. These are more regular in California than in the Pacific Northwest.

Sept 18 – Another gorgeous juv. The feathers can often have a cinnamon brown tone.

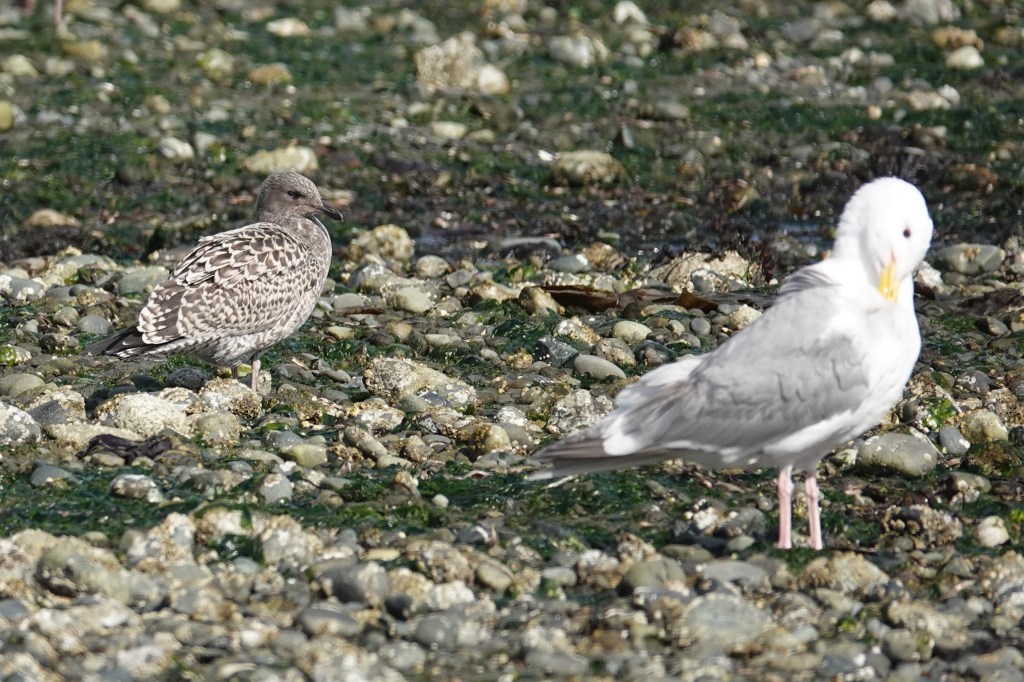
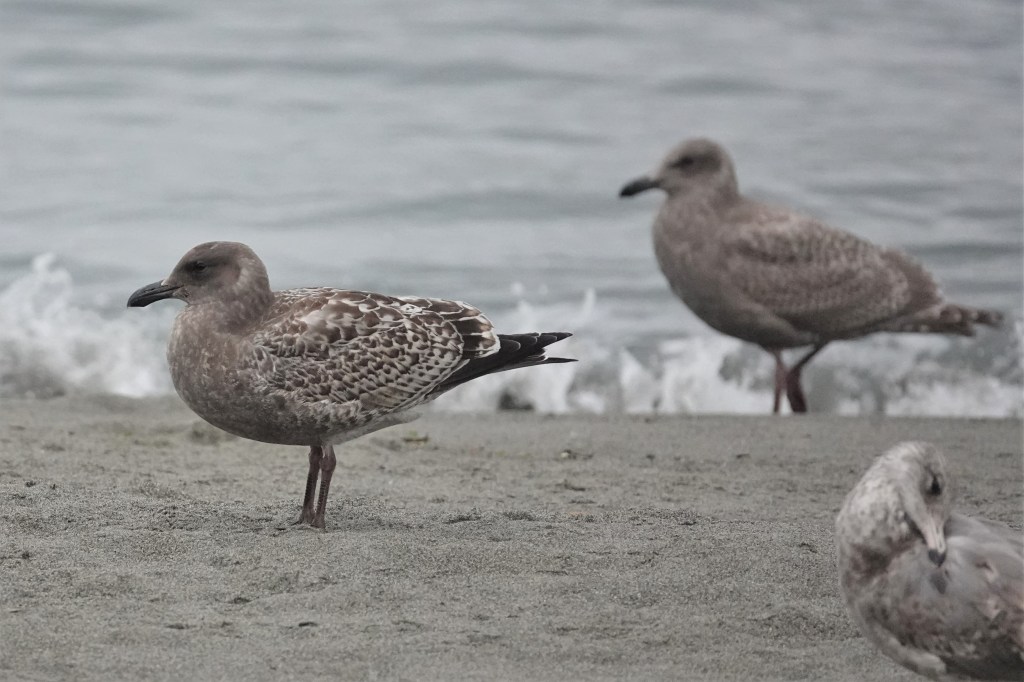
Sept 29 – California on the left; Olympic on the right. Both of these birds have started molting scapulars. They both have pink legs in first cycle, though Calif Gull legs are paler pink.

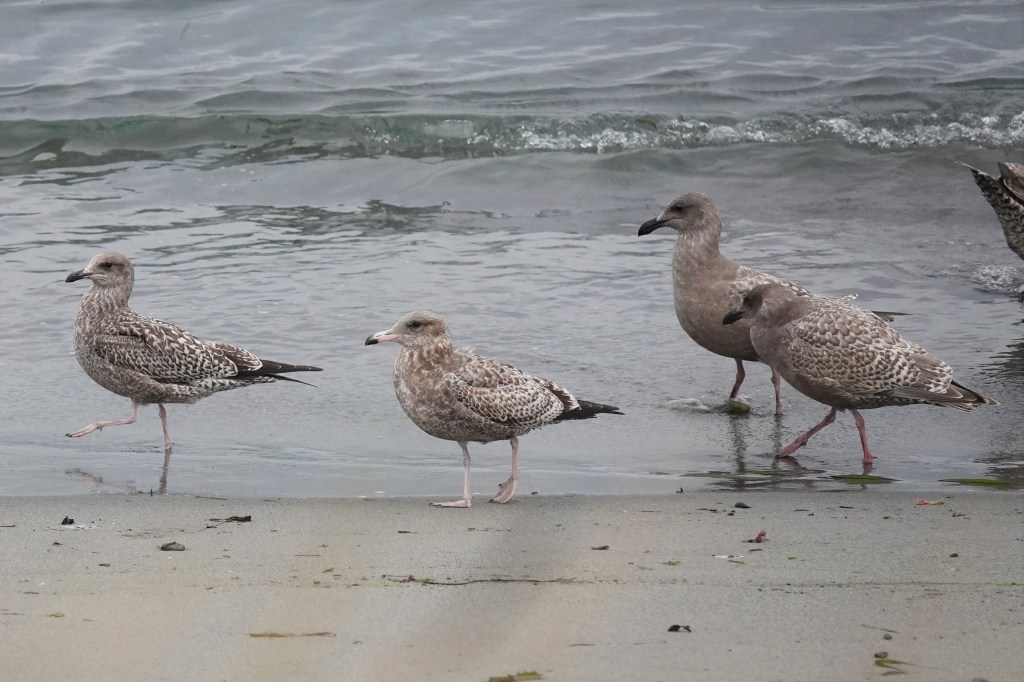
Sept 29 – Two California’s on the left; two Olympics on the right. All juveniles. Note the left California Gull still has an all-black bill. The California Gulls stand out by their smaller size, more horizontal backs, and long, black wingtips.

June 26 – We’re now through spring into summer. This bird is approaching its first birthday and is showing the classic tri-color pattern of relatively fresh gray scapulars, faded white coverts, and tattered primaries, now faded from black to brown.

July 6 – A similar late 1st cycle California Gull. Note the legs can turn rather blueish.

July 11 – This fly-by bird reveals it has begun molting its inner primaries – the fresh gray ones.

Aug 2 – This bird is probably a year more ahead, molting from 2nd to 3rd cycle. The legs are still rather bluish gray.

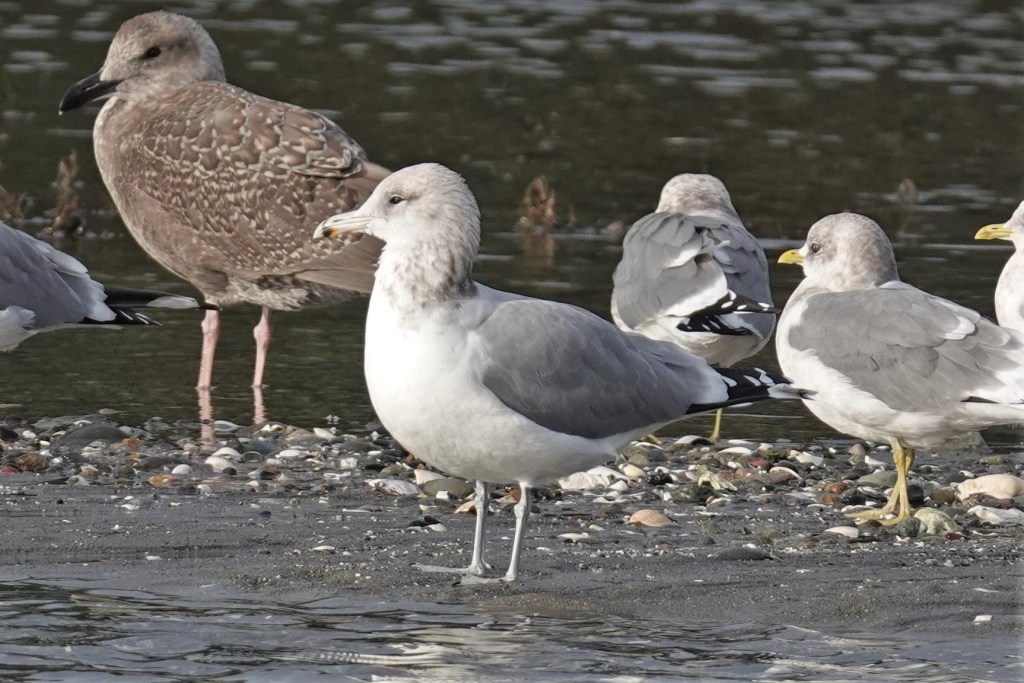
Dec 9 – This bird is a full adult, with black and red near the tip of the yellow bill. The blue legs will turn yellow by spring. Olympic back left; Short-billed Gulls back right.

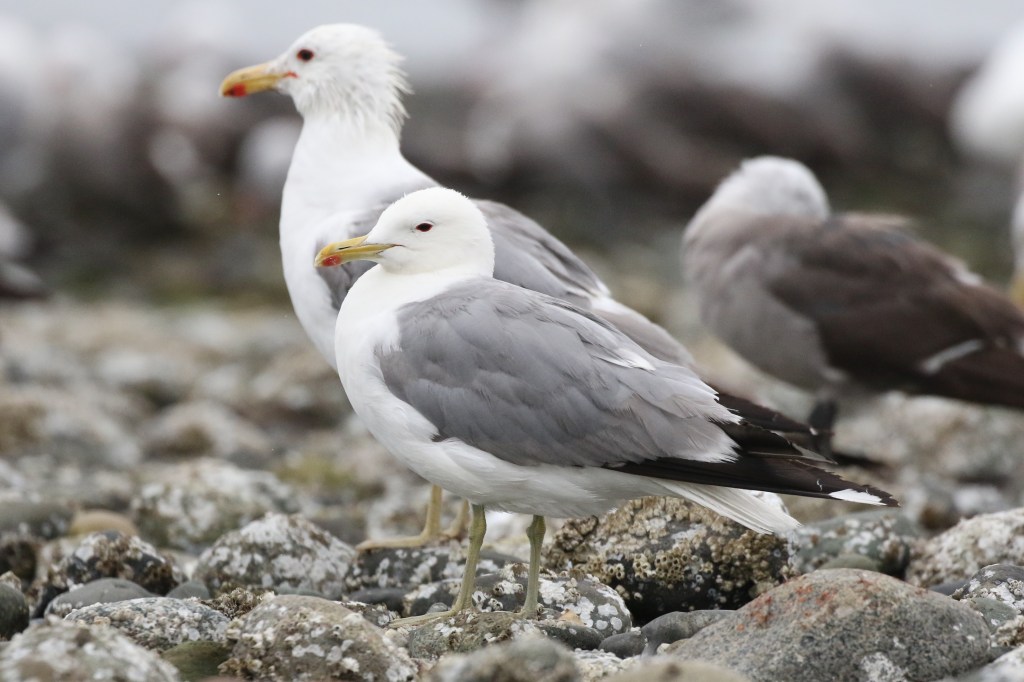
July 15 – Finally, a full adult California Gull with yellow legs. Note the dark eye with red orbital ring and red gape (where the bill meets the face). The adult in the background with the messed up head feathers especially shows the red gape. Heermann’s back right. The black mark on the bill is much reduced when breeding.

Short-billed Gull

These petite beauties arrive in the fall to spend the winter, departing by May to breed in Alaska and Canada.

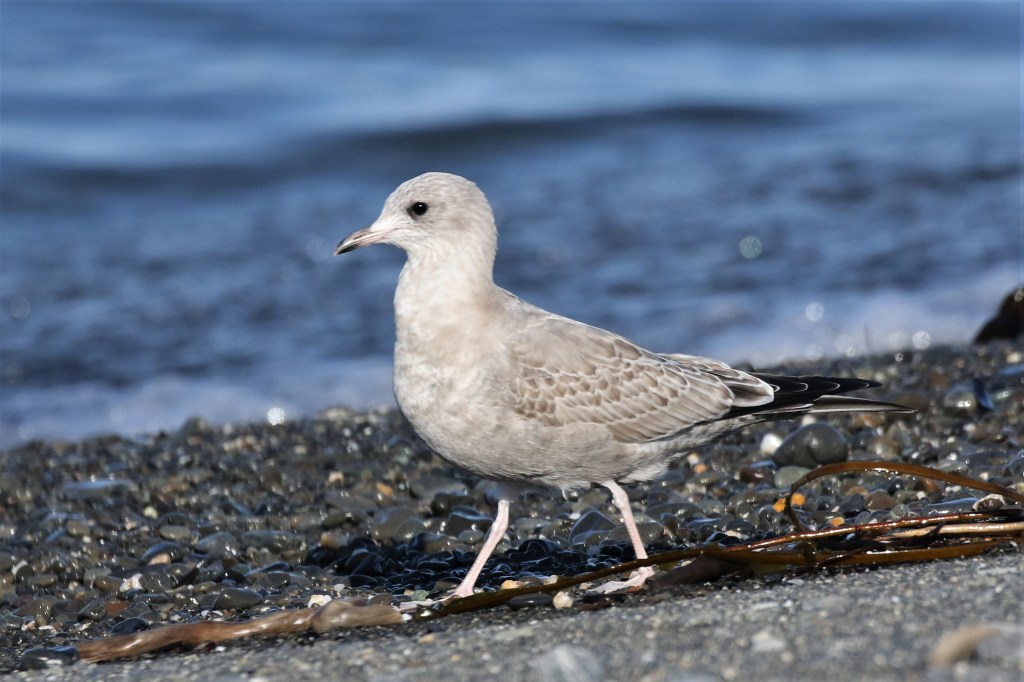
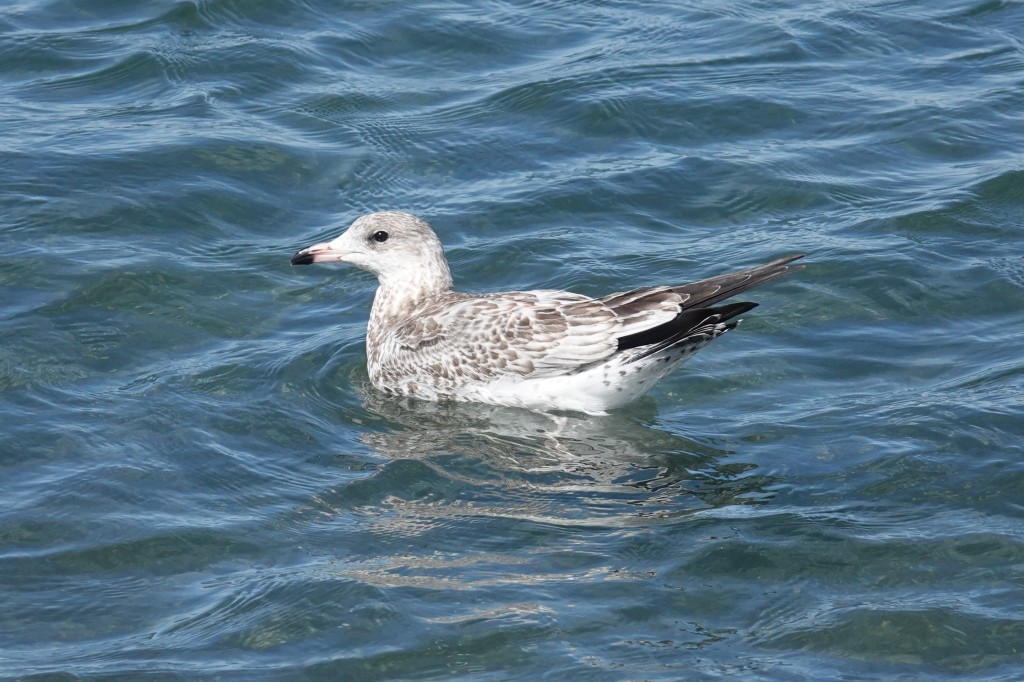
Oct 4 – The fresh juvs look like miniature Thayer’s Gulls, but are as dainty as fairies. Note the tiny thin bill and dove-like head with a relatively large eye. Also bantam chicken-like chest and very long tapered wings.

Nov 12 – Because this is a three-year gull, the 1st cycle birds quickly resemble 2nd cycle in large gulls, in that they have “adult gray” back and scapulars. This contrasts with the brown coverts.

Jan 9 – In flight they have a rather solid tail (unlike Ring-billed Gull).

Apr 25 – Here we are in spring. The brown coverts have faded to white, and head and body molt has also created a paler appearance.

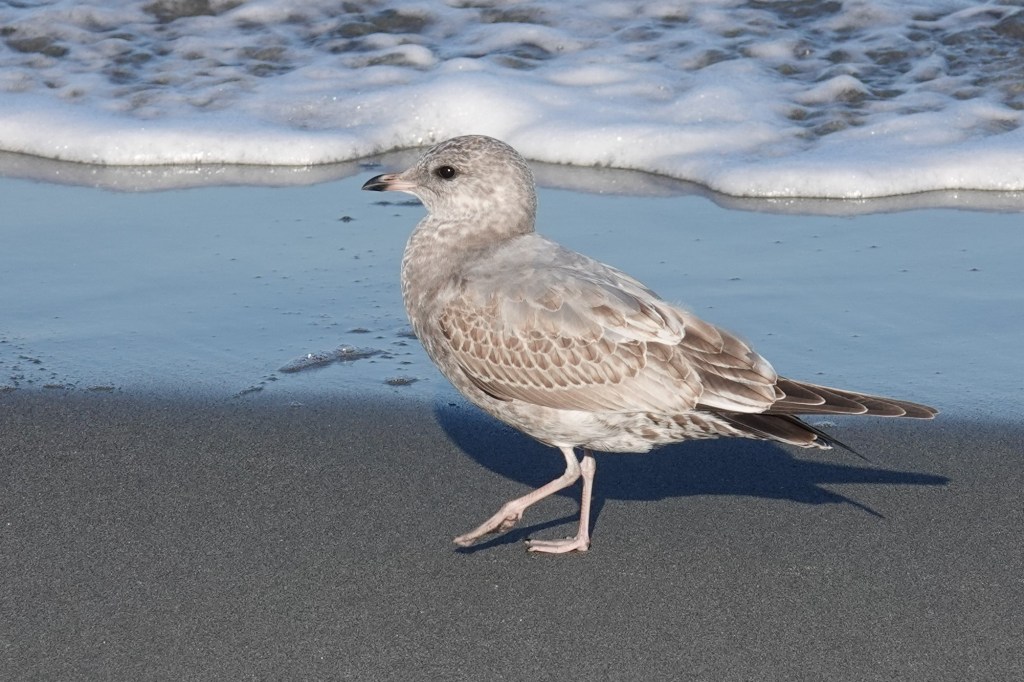
July 14 – Occasionally, some late 1st cycle birds will over-summer. These often bleach to a nearly completely white, baffling birders. The bill seems longer than usual because the head feathers are molting.

Sept 18 – This is an adult just arrived from the north. Note the tiny unmarked yellow bill, somewhat unique in the gull world. California, Olympic, and Heermann’s tower over this tiny gull.

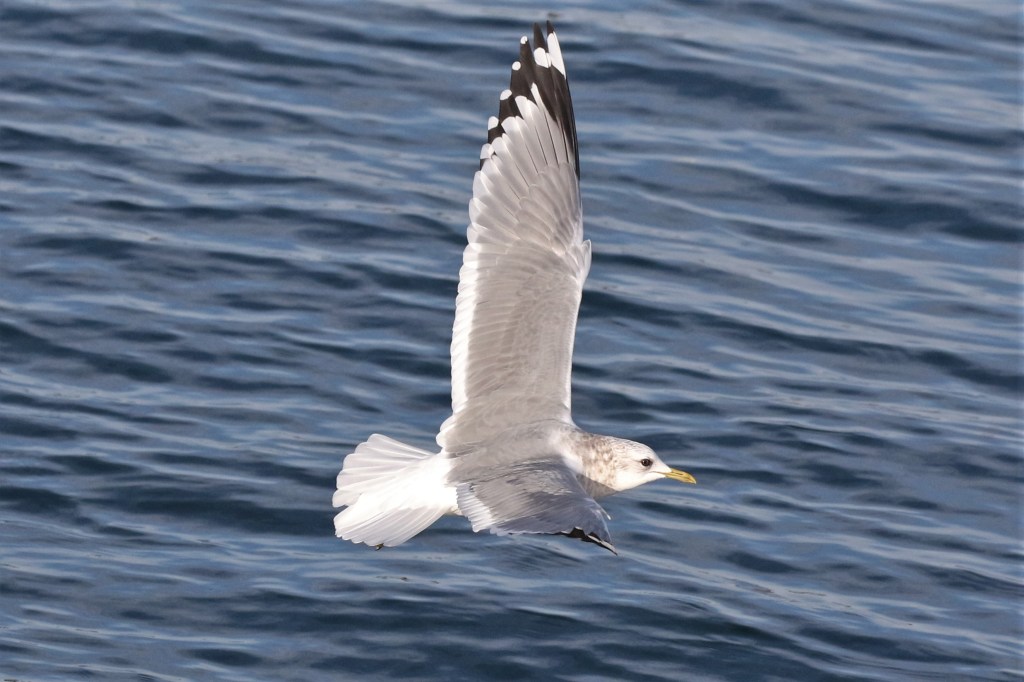
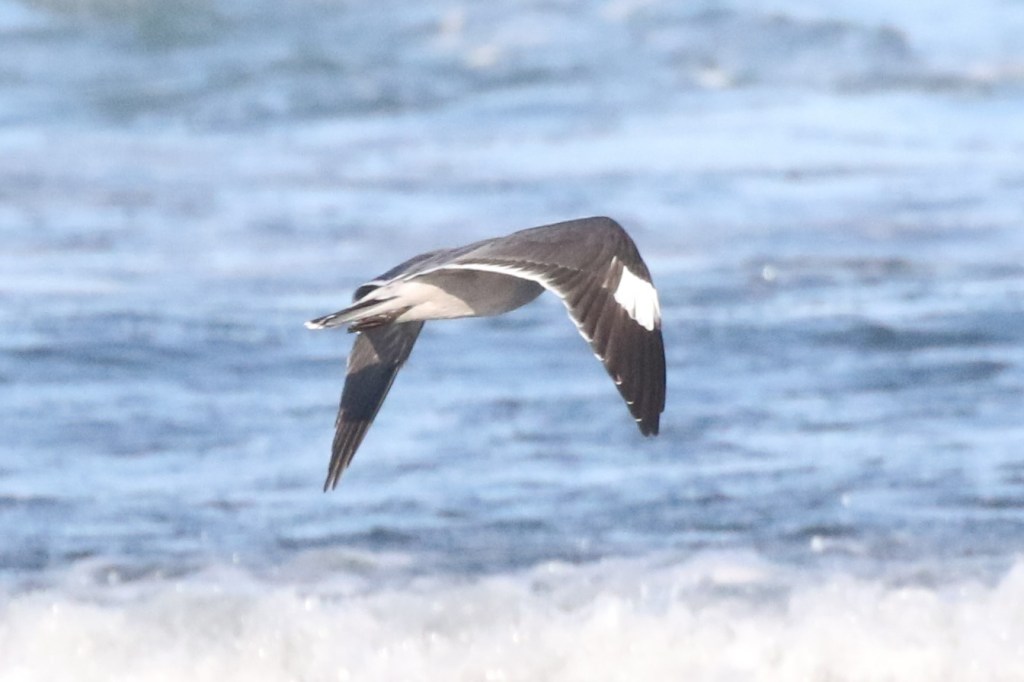
Jan 8 – Winter adults are beautiful in flight, with considerable white in the primary pattern: mirrors on P10 and P9, and a white “string of pearls” between the gray and black in Ps 4-8 (the Slaty-backed pattern). The exact pattern is variable.

Mar 25 – The amount of head and neck smudging in variable. Note that some birds will show a yellow eye.

Apr 25 – As spring gets on, the head markings resolve to a clean white head and the bill brightens as the breeding season approaches. This means they’re about to head north.

Heermann’s Gull

A striking and unique gull, nearly the entire world’s population emanates from tiny Isla Rasa in the Gulf of Mexico. After breeding, they migrate north. About 400 typically spend the summer and early fall around Port Townsend.

July 27 – The fresh juveniles are brown with mostly dark bills. The pale feather edges wear off quickly.

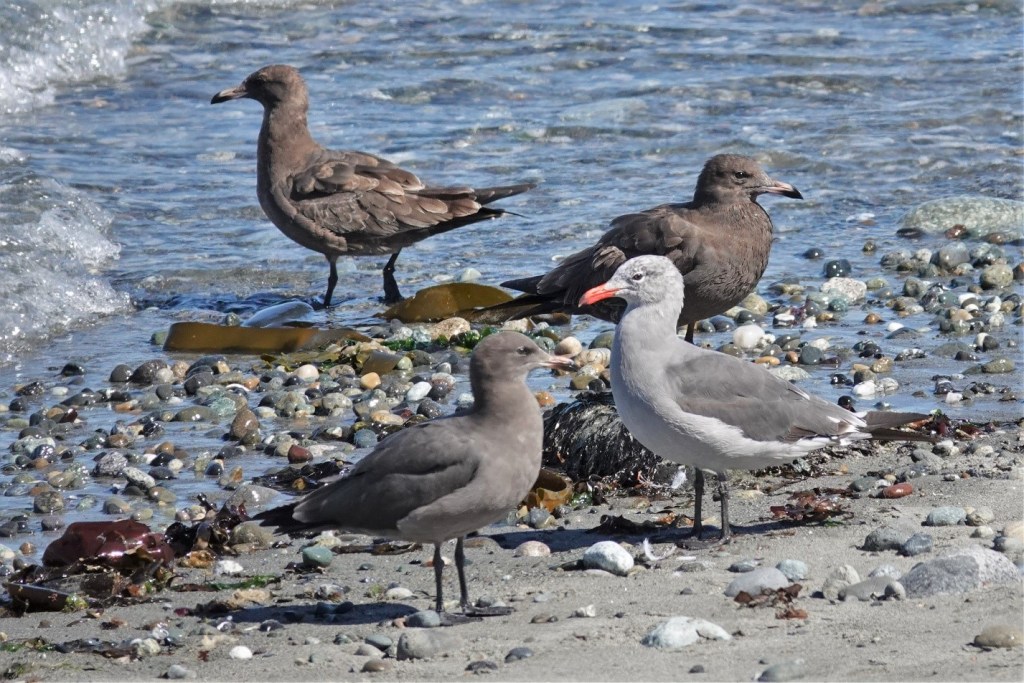
Aug 15 – This is a four-year gull. This photo features two brown juveniles in the back (molting their scapulars), a 2nd cycle front left, and an adult front right. Heermann’s Gulls have black legs at all ages.

Aug 26 – This 2nd cycle bird looks a lot like 1st cycle. It has a more orange bill.

June 29 – Breeding plumage adults are remarkable for their bright red bills, clean white heads, and smoky gray bodies.

Aug 26 – Adults in the August conspicuously molt their flight feathers and tails.

Oct 5 – Adults in complete basic plumage, with mottled dark heads.

Oct 4 – A small percentage of adults show “jaeger-morph” wing patterns, with variable amounts of white in the primary coverts. This adds to their jaeger habits of chasing other gulls.

Bonaparte’s Gull

Even smaller and daintier than Short-billed, Bonaparte’s Gulls are easy to identify and a joy to watch. I’ll leave it to other sources to help you pick out a Black-headed or Little Gull among them. Suffice it to say, the former is more larger, and the latter slightly smaller, than Bonaparte’s. These northern breeders are present throughout much of the year – except summer – with pulses during spring and fall migration. Hundreds can be found at Point No Point, often harassed by jaegers in the fall.

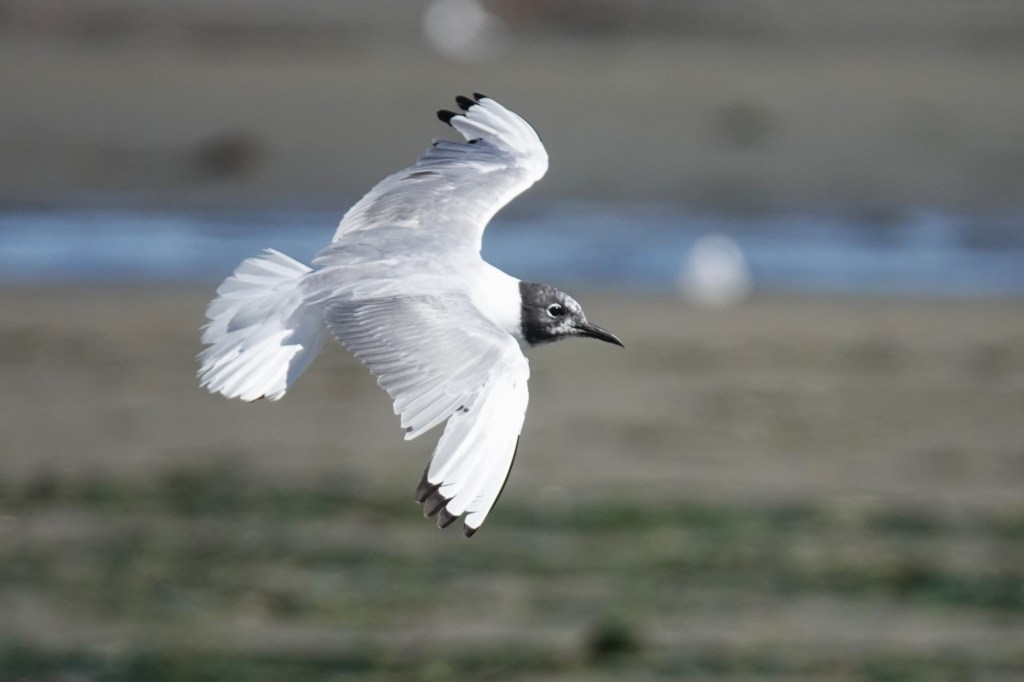
Aug 3 – A gorgeous freshly-arrived juvenile with the characteristic black year patch.

Aug 3 – Newly arrived adults, one still with an all-black head.

Aug 3 – An adult in flight, molting its primaries.

Nov 29 – An adult in full basic (winter) plumage. It appears to have an injury in the shoulder area.

Glaucous-winged Gull

Pure Glaucous-winged Gulls are challenging for me to find among the crowd of Olympics. At best, they are uncommon in winter and rare in summer, largely limited to a few over-summering subadults. That said, an influx in winter can match Olympic numbers at some roosts between Sequim and Neah Bay.

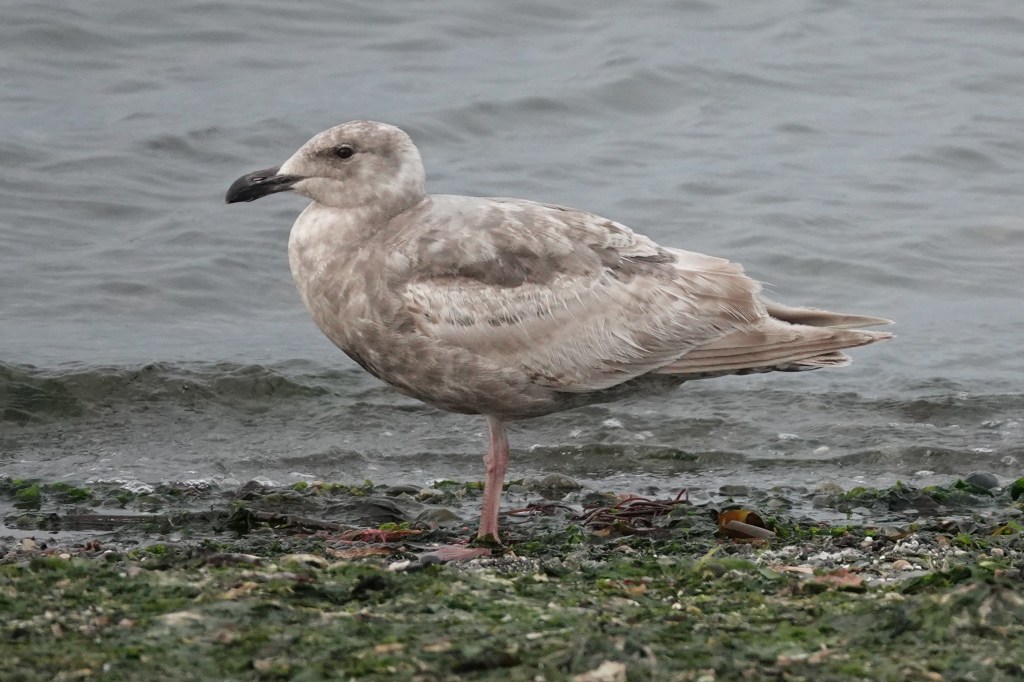
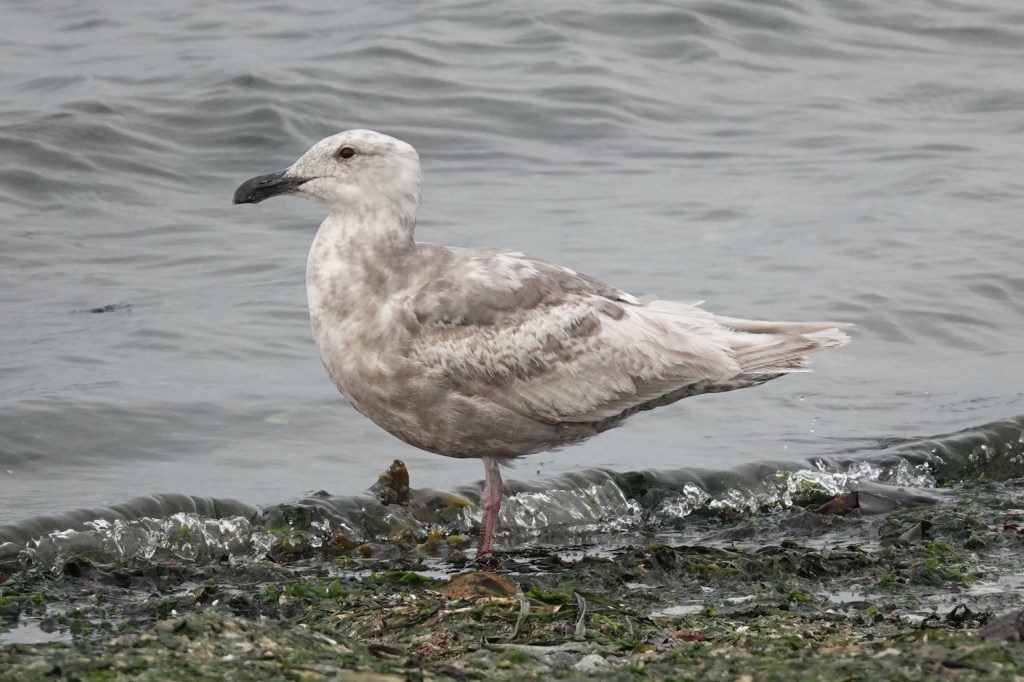
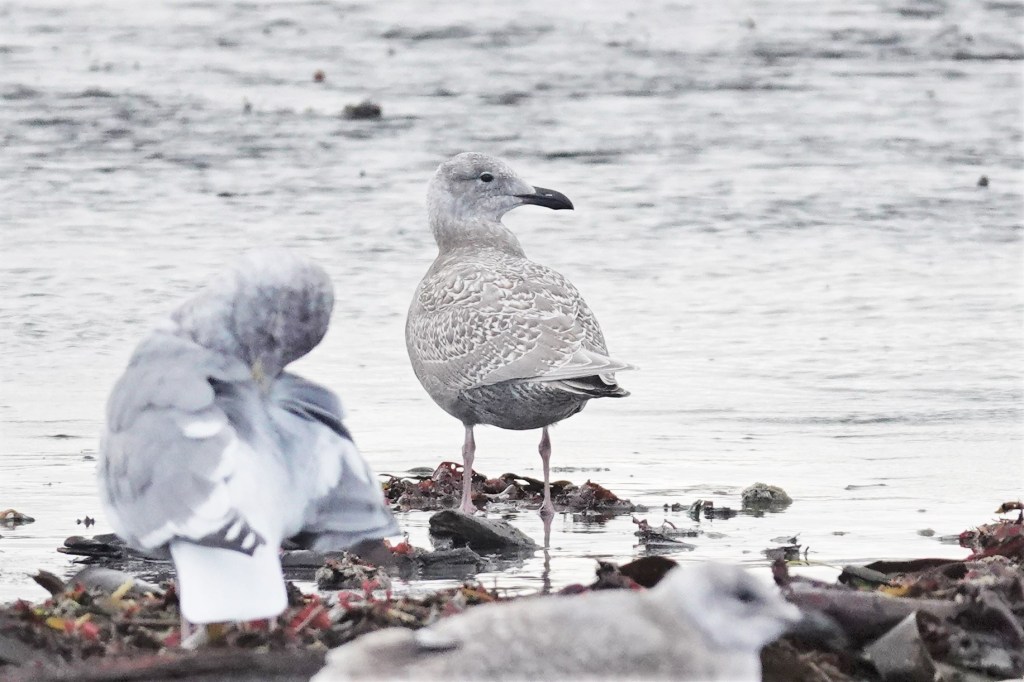
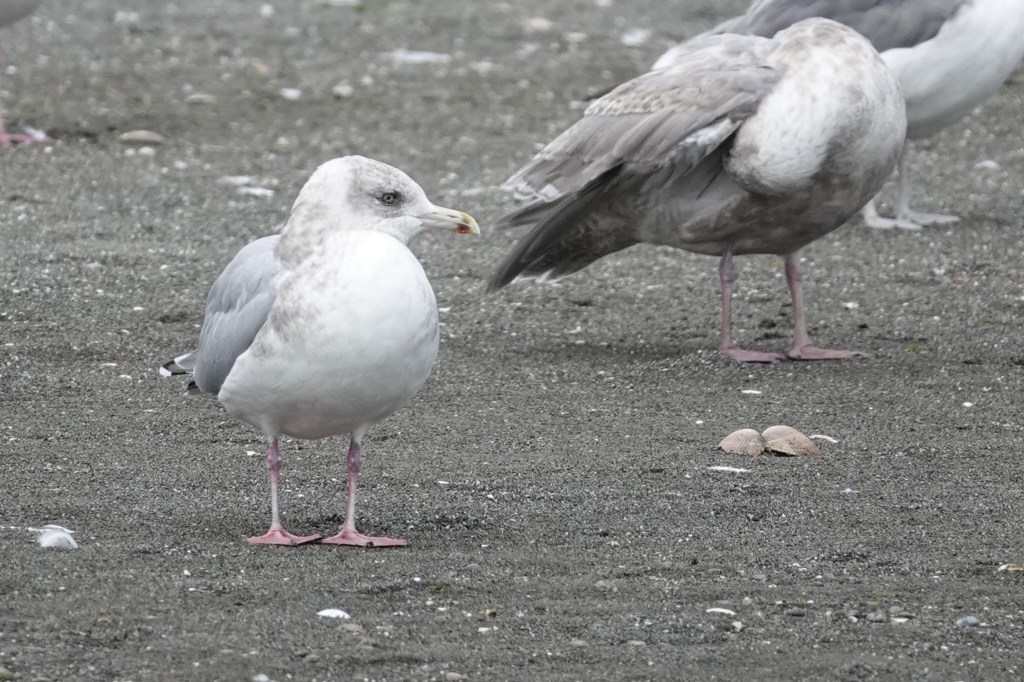
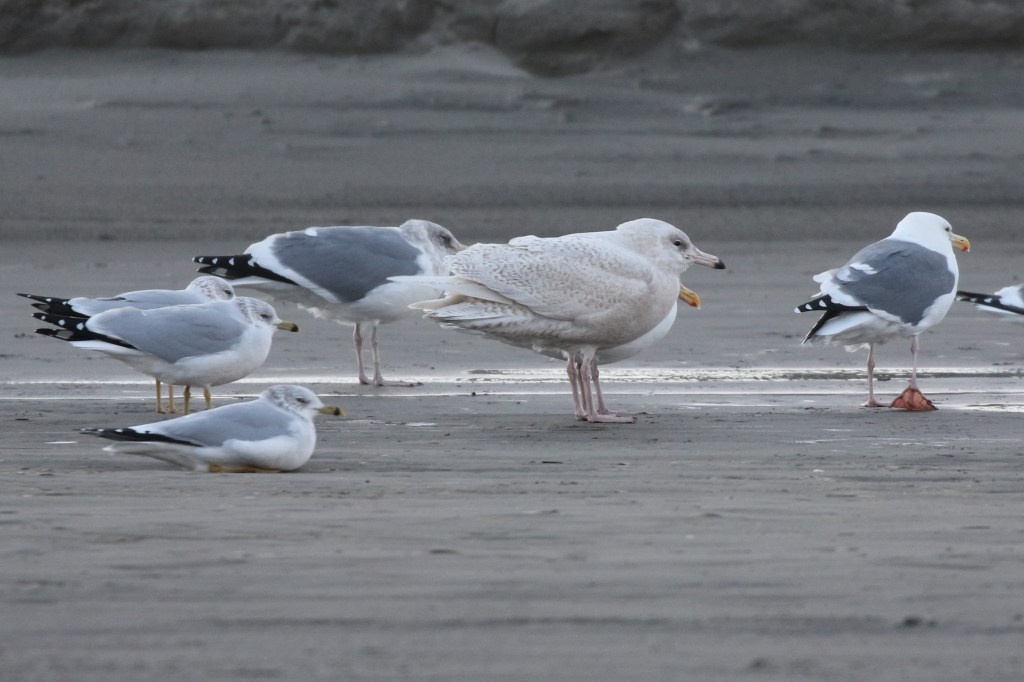
Oct 5 – Given the dusky auriculars and rather bulbous bill, this bird probably has some Western in it. Nevertheless, note the even pale tones throughout.

Oct 28 – There’s no question about this bird. The primaries are as pale as they come, as is the tail. The auriculars have no indications of a sooty wash. The coverts are intricately patterned. Note the scapulars are fully molted.

Nov 1 – Olympic on the left; Glaucous-winged on the right. At this date, fading is not an issue.

Nov 6 – This bird shows no auricular patch. The primaries are almost patterned as in Glaucous and Iceland. Note the bill, while heavy, is less blob-ended than Western or Olympic, with a shallower gonydeal angle. The tomium (upper edge) often begins a gentle curve about 2/3 of the way out, rather than a strong hook ¾ of the way out, as is typical in Western and Olympic.

Nov 7 – This bird shows a hint of subterminal arrowhead patterns in the primaries. Note the straight bill without a contrasting blob ending.

Nov 12 – Note the whitish head on this fall bird. The primaries on this one are quite pale. Olympic in foreground.

May 7 – By spring, Glaucous-winged Gulls can fade to nearly all white. Note the bill is beginning to pale.

May 12 – Another spring bird, though this one seems less faded. Again, the bill is paling and more straight than Olympic.

June 29 – As they molt coverts, Glaucous-winged Gulls often produce this striking pattern due to fresh dark coverts.

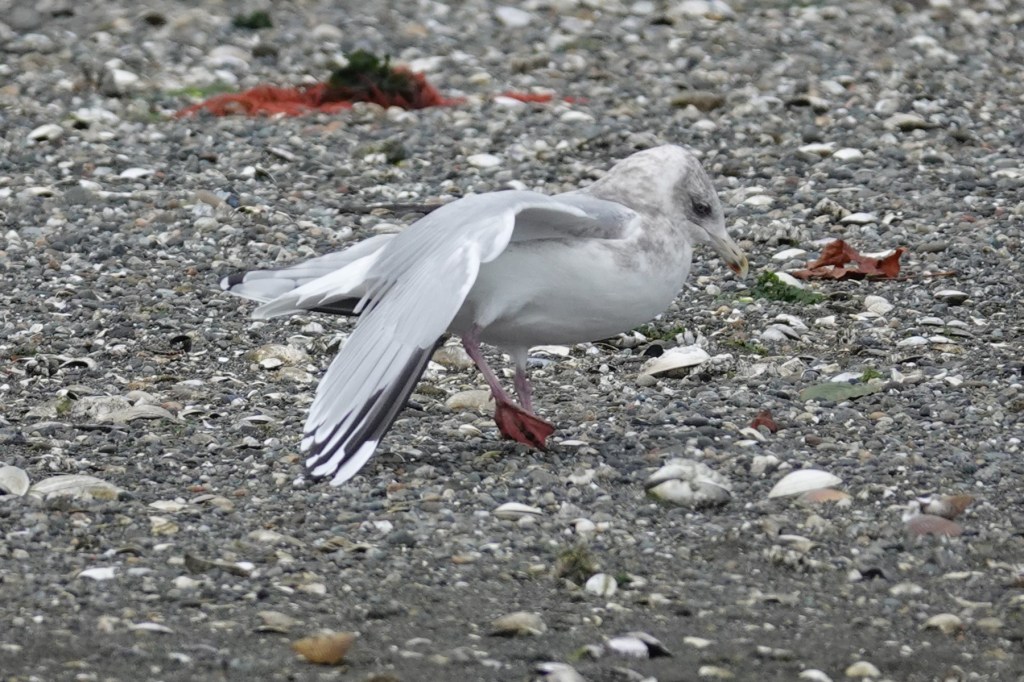
July 6 – Over-summering late 1st cycle birds often stand out in Puget Sound. Feathers with less melanin (paler feathers) are more prone to wear and fading than darker feathers.

July 14 – This bird could be confused for Glaucous, but a Glaucous would never have dark in the middle of the bill. Given the time of year, this bird is typical of an over-summering one-year-old Glaucous-winged Gull.

July 27 – Another over-summering 1st cycle Glaucous-winged, in desperate need of molt.

June 8 – We’re now a year later. This bird is late 2nd cycle, with a bill that is already acquiring yellow tones.

Jan 17 – A presumed pure adult Glaucous-winged Gull in mid-winter. Note the icy gray mantle and nearly matching primaries (though they are more slate gray than blue-gray), the purplish legs, the rather straight bill, and the straw yellow bill with the dark mark thru the red spot.

Ring-billed Gull

Ring-billed Gulls are rather rare to uncommon around Port Townsend. I only see them in small numbers (usually three or less) in late summer and fall. Apparently they are more common in the South Sound.

Aug 25 – Compared to California Gulls, the juveniles are smaller, whiter, and with brighter pink in the bill.

Nov 15 – In flight, 1st cycle birds have a tail with a messy band. California and Short-billed Gulls have much more solid brownish/blackish tails. Also note the very contrasting wing pattern with very pale window in the inner primaries.

Aug 19 – Adult Ring-billed Gulls have very pale mantles. They can be told from Short-billed Gull at a hundred yards by the lack of a contrasting white tertial crescent between the gray mantle and black primaries. The pale gray just fades into the black with only a small white fringe.

Thayer’s Iceland Gull

Gulling is traditionally best in the winter, when Arctic breeders such as Thayer’s Iceland Gull arrive. This is difficult in Port Townsend, as there are few high tide roosts nearby. In winter, there are rarely low tides during limited daylight hours. Thus, I usually only see a few Thayer’s, if any, on any given day. They are much more regular at the Elwha River Mouth, which also has suitable high tide roosts for midday viewing.

Nov 7 – Of the large four-year gulls, Thayer’s is amongst the smallest. Fresh juveniles resemble fresh Olympics with their checkering and coffee with cream tones, but their structure is very different. Note the thin bill and long primaries, almost always darker than the body and with pale edges.

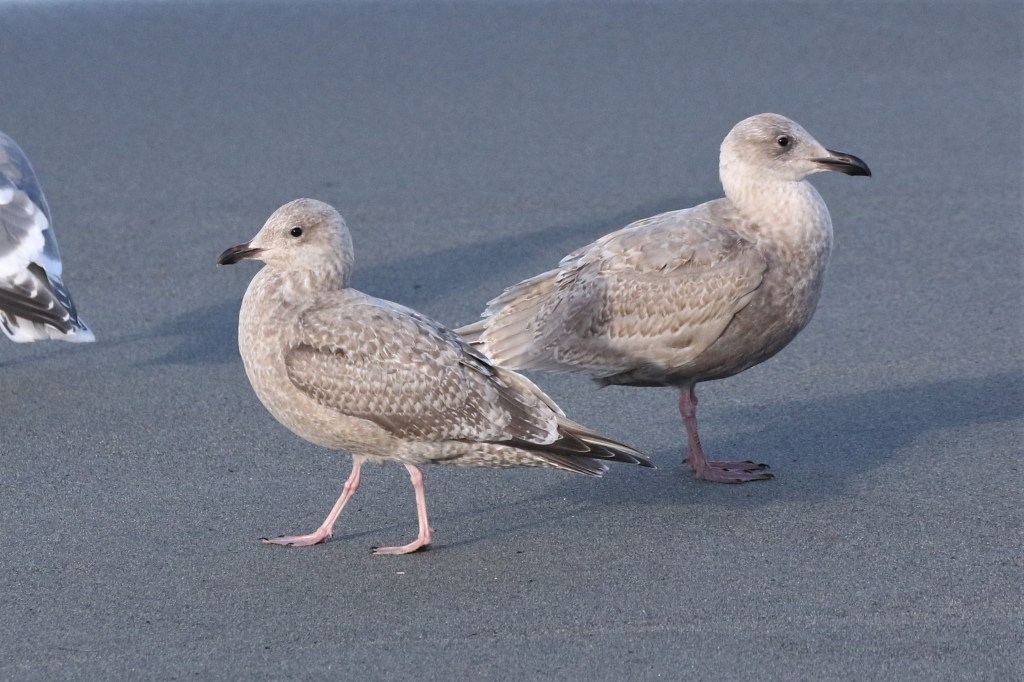
Jan 9 – Thayer’s on the left; Olympic (or possibly Glaucous-winged) on the right. The main differences: Thayer’s is smaller, longer winged, has a much tinier bill, and generally retains its scaled juvenile scapulars through the winter; the Olympic has already molted them.

Sept 22 – From left to right: Heermann’s, Thayer’s, California, and Olympic. On the Thayer’s, note the dark eye, bright pink legs, and primary pattern with the pale underside of the far primary. This is actually P9 we are looking at. P10 is missing due to molt.

Oct 11 – Thayer’s often appear petite and squat, though they are slightly larger than a California Gull. Note the small bill. Many individuals show a gold eye.

Oct 11 – This is the same bird as above, showing off their unique primary pattern. P10 has a large terminal mirror (all white tip). P9 has a mirror that swirls open toward the inside of the wing.

Nov 15 – Here’s another view of the primary pattern, which produces a striped effect.

Feb 26 – How to pic a Thayer’s out of a flock of Olympic Gulls. It’s the small one in front. Note the jet black in the primary pattern, the thin bill, and the overall petite structure (it probably weighs 30% less than the Olympics). Note also the underside of the far primary on the folded wing is pale — this rules out Herring. The dark eye also rules out Herring (though some adult Thayer’s have somewhat pale eyes). The back left bird is a 2nd cycle Thayer’s — note the thin bill.

Herring Gull

Sept 18 – I see even fewer Herrings than Thayer’s, usually just a few each winter, unless I go to Elwha. Compared to Thayer’s and Olympic, note the black primaries and very dark tertials. The coverts are usually very checkered and contrasting. The bill can vary from all black to dirty pink with a dark tip.

Dec 2 – Here’s another Herring. Note the black primaries and contrasting pale head, a common feature.

Jan 30 – An adult in flight. They always have a very pale straw-colored eye, producing a fierce look. The mantle is pale icy blue. The typical primary pattern has only a single mirror on P10.

Western Gull

Sept 16 – Pure Western Gulls are rare in Puget Sound. I usually only see them in fall or winter after strong west winds. This juvenile shows a dark sooty face (similar to many Olympics) but also jet black primaries. Note also the more contrasting coverts, not the uniform muddy tones of Olympics. That’s a juvenile Olympic back right.

Sept 29 – This 3rd cycle Western shows a fairly dark mantle and jet black primaries.

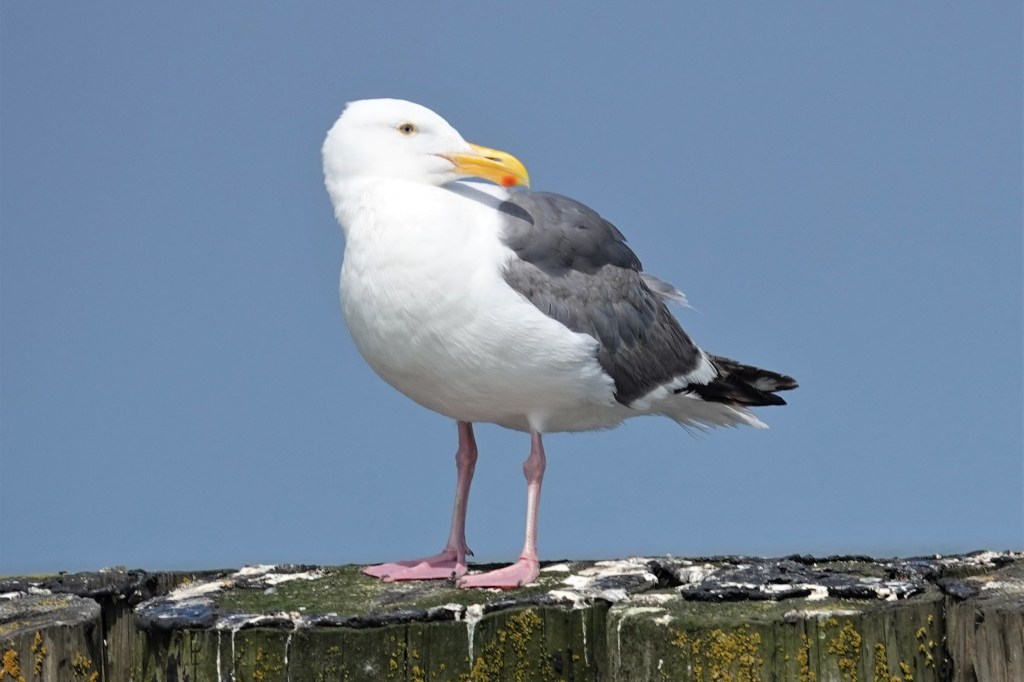
July 27 – This summer adult is a classic Western: a clean white head (which they keep year round), a thick bulbous school bus yellow bill, a darkish mantle, and jet black in the primaries. Note also the yellow orbital ring. The eye varies from yellow to dark.

Herring x Glaucous-winged Gull (“Cook Inlet Gull”)

I only report a few of these each winter, usually at Elwha or Neah Bay. They are probably regular but rare in Puget Sound, but they are really a pain to pick out amongst all the Olympics!

Nov 6 – This one is easy to separate from Olympic – it has a pale version of the Herring Gull bill, pale with a black tip. The dark gray primaries rule out black-primaried gulls and imply either a Thayer’s or Gl-W hybrid. The molted scapulars, structure, and gray color tones rule out Thayer’s. Olympic in the background.

Nov 12 – A likely Cook Inlet, with a straighter and more paling bill than found on Olympic. Cook Inlets often retain juvenile scapulars later in the winter, as this one has. Note also the longer-winged structure.

Jan 8 – Another potential Cook Inlet with unmolted scaps (in January!) and a longer-winged structure than Olympic. The more squared off and contrasting pale head also suggests Herring influence. 2nd cycle Olympic in the background.

Glaucous Gull

Large and white, these are rare winter visitors.

Nov 9 – Most Glaucous Gulls in Washington are 1st cycle birds, like this one. I took this on the beach at Ocean Park. It is accompanied by adult Ring-billed and Western Gulls. The bill is always pink with a well-demarcated black tip. Glaucous-winged never approaches this at any age. Note the bill is also straight and not blob-ended.

Rarities: These species, listed roughly in order of probability, occur less than annually:  Franklin’s Gull, Lesser Black-backed Gull, Black-legged Kittiwake, Black-headed Gull, Little Gull, Slaty-backed Gull, Black-tailed Gull, Ross’s Gull

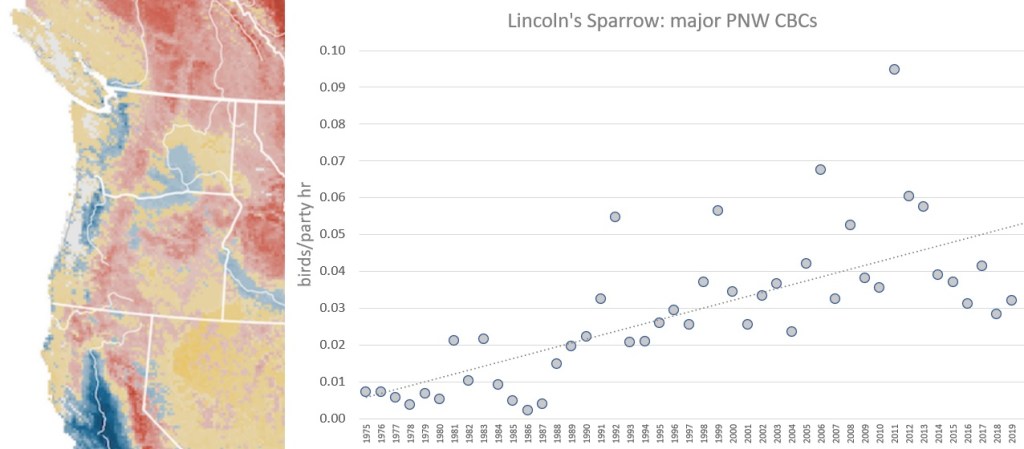
Probability by season

It always helps to know which gull species are around at any one time during the year. eBird data for gulls in Puget Sound is of little use due to widespread misidentifications. This graph is based on my personal eBird data from Pt Wilson and Pt Hudson near Port Townsend. Frequency may vary around the Sound and at other gull roosts. For example, Ring-billed Gull is quite regular in the South Sound earlier in the year, and Thayer’s and Herring are regular at the Elwha River Mouth in winter.

After hazing and avian flu: Will the last colony of Caspian Terns in the Salish Sea survive?

The Caspian Tern colony, the one across the bay from the Port Townsend waterfront, was just wiped out by avian flu. Nearly. At the start of the summer, we estimated the colony at about 1,800 adults. So far, the Washington Department of Fish and Wildlife (WDFW) – in five trips to the island, roughly once a week – has picked up over 1,100 dead adults and 500 dead chicks.

This is painful on several levels.

First, this colony, on Rat Island just off the tip of the spit at Fort Flagler Campground, is a relatively new phenomenon. Analysis of satellite images suggest it began last year. Unfortunately, in 2022, in two attempts, about 500 to 1,000 adults produced maybe a dozen fledglings. The first attempt was wiped out by human disturbance. A minus-four tide on the Fourth of July enticed many campers to walk from the spit to the island. I personally watched through my scope as a couple with a dog (on a leash) walked right up to the colony, putting all the birds up in the air, and stood there, naively enjoying the birds and filming them with their phones. Unbeknownst to them, gulls were pouring in underneath the cacophonous mob of terns, no doubt devouring eggs and chicks. This is how human disturbance impacts seabird colonies. A month later, the gulls tried again. This time a coyote managed to swim across from Indian Island and had a feast. Coyotes previously wiped out a colony on the tip of Dungeness Spit.

This year we were prepared to at least address the human disturbance problem. As the Conservation Chair of Admiralty Audubon, I reached out to State Parks and WDFW. They contacted the Friends of Fort Flagler, who created a team of 25 volunteers to serve as docents during extreme low tides to intercept and educate beachgoers about the terns – and the harbor seal haul-out next to it. WDFW put up signs around the island to educate kayakers.

Everyone was trained and more birds than ever came to nest. They seemed to be doing great. Most were on eggs, and we estimated they were just about to hatch. Then, on July 10, Sam Kaviar, a naturalist guide who runs Olympic Kayak Tours, noticed a dead tern. Not a big deal, I told him, unless you start seeing more. Within two hours, he saw a dozen more. He called WDFW. They were nearby in a boat so came over to check it out. They collected 35 dead terns and suspected highly pathogenic avian influenza (HPAI), also known as H5N1. They collected carcasses to run tests, which eventually came back positive.

The second painful thing is that Caspian Terns are a long-lived slow-reproducing species. The loss of chicks is one thing, but the loss of adults is a much bigger deal. Caspian Terns, the largest tern in the world, can live 26 years. Most adults live 10 to 15 years. This means they only need to reproduce themselves once every 15 years or so to sustain their population. It also means that, if you lose an adult, it might take 15 years to replace them.

The third painful thing is that Caspian Terns are already declining, both in the Pacific Northwest, up and down the entire West Coast, and across the whole continent. The Birds of the World species account for Caspian Tern, in the section on conservation concerns, highlights their need for disturbance-free nesting sites, “Human disturbance at colonies facilitates egg predation by gulls when more wary terns are flushed from nests.”

The fourth painful thing is that Caspian Terns were deliberately pushed off from most of their other breeding sites in the Pacific Northwest in the past 15 years. They do not nest scattered across the landscape like robins or even gulls. Like many seabirds, they nest in tight colonies, packed together, one nest every few feet. In the Pacific Northwest, enormous colonies were hazed off Sand Island in the Columbia River delta by government agencies because they were eating too many salmon smolts – which are endangered because of the dams. (Note, photos of prey items at Rat Island have shown the terns eating candlefish, herring, smelt, surf perch, and juvenile salmon – the latter only toward the end of their nesting period.) Many relocated to rooftops in Seattle or to empty lots in Bellingham. In recent years, they have been hazed off there too. That is exactly why the Rat Island colony near Port Townsend grew so suddenly. It is a colony of refugees. We have photographed birds there that were banded at Sand Island, in Bellingham, even from the Tri-Cities area. This spring, as the colony was forming, local experts concluded that this was the only Caspian Tern colony in the Salish Sea.

Now 80% of them are dead.

Like Covid, HPAI has recently become part of our world. The United Nations issued a concise report about it in July 2023. They open with this: “H5N1 high pathogenicity avian influenza (HPAI) is currently causing unparalleled mortality of wild birds and mammals worldwide…” They describe it as unprecedented based on the scale of mortality (often approaching 90%) and geographic spread (nearly worldwide). In Washington, it was first detected last winter in waterfowl (mostly Snow Geese) in the Skagit Flats.

This summer’s outbreak at the tern colony is the first known incidence of HPAI in wild birds in the breeding season in Washington. A smaller outbreak is on-going among Caspian Terns at the Columbia River delta. Fears that it would spread to the harbor seals or dogs at the Fort Flagler campground have not materialized. Some dead gulls, especially chicks, have tested positive, though in general, the gulls have been much less affected. There are several hundred “Olympic Gulls” – Glaucous-winged x Western Gull hybrids that nest at Rat Island near the terns. Bald Eagles and Black Oystercatchers are also present near the colony and potentially vulnerable, though no dead birds of these species have been found. The largest seabird colony in the region is at Protection Island, with over 10,000 Rhinoceros Auklets. That is only nine miles away as the tern flies. While terns forage near Protection Island, and auklets forage near Rat Island, there has been no evidence of transmission to the auklets. In fact, HPAI is unknown in alcids so far. 

Hope remains. On my last visit to the island, on August 11, there were still approximately 350 adults. Some were flying into the colony carrying fish. On the beach, I could see about a dozen chicks of varying ages, adults offering them fish, as well as a few dead adults and others that appeared sick. I am hopeful that over 10% of the adults will survive. That sounds pathetic, but it’s a start. Perhaps they will be immune to avian flu and so will their offspring. We don’t know yet. And, despite the carnage, it looks like this colony may actually produce more fledges than last year. So that’s another start. Chicks leave the colony about 45 days after hatching. That should be soon for some of them. They can’t get away fast enough.

The Limpkin explosion: Like an invasive species in a changed world

When this field guide was published in 1966, it was clear from the range map that, if I wanted to see a Limpkin in the US, I had to go to Florida.

Limpkin species account from 1966 Golden Field Guide.
The Limpkin range map from this popular 1966 field guide.

Growing up as a kid birder in the 1970s, this was one of my first field guides. I did not see my first Limpkin until decades later, in 2005. At that time, this freshwater snail and mussel specialist was still largely a Florida bird, with only a scattering of records north of their usual range.

Limpkin records north of Charleston, SC up thru 2015
Extra-limital records up thru 2015 (on eBird).

Between 1956 and 2015, eBird shows only 18 Limpkin sightings north of Charleston, South Carolina, though presumably some historical records have not been entered. Suffice it to say, a Limpkin in this region was a rarity. There were no Gulf Coast records in Texas, Louisiana, Mississippi, or Alabama, and only a few in the Florida panhandle west of the Tallahassee area.

Suddenly, all this changed. 2019 saw records from Illinois, Ohio, Virginia, and coastal Louisiana, in addition to dozens of records from Alabama, Georgia, and South Carolina. 2020 and 2021 added a scattering of records from Texas to Minnesota(!) to Maryland.

Extralimital Limpkin records across the eastern US in 2022 and 2023 (so far)
The remarkable Limpkin invasion so far.

In 2022, they simply exploded, with first state records across much of the continent. 2023 looks like it is picking up where last year left off.

This kind of rapid range expansion is typically seen in invasive species who are introduced into a new ecosystem. They either die out or explode. The Limpkin invasion, however, is not because they have just arrived in Florida — they are a native species — but because the ecosystem north of Florida has been transformed by a warming climate. It is as if they have landed on a new continent. They are following food — an invasive apple snail, as well as freshwater mussels.

This kind of poleward range expansion is predicted with climate change and has already been documented in hundreds of species. See, for example, my posts here:

And these scientific papers:

  •  Amano et al. 2020. Responses of global waterbird populations to climate change vary with latitude. 10: 959-964.Chen et al. 2011. Rapid range shifts of species associated with high levels of climate warming. Science 333 (6045): 1024-1026.
  • Devictor et al 2008. Birds are tracking climate warming, but not fast enough. Proc. R. Soc. B 275, 2743–2748.
  • Hitch and Leberg. 2007. Breeding distributions of North American bird species moving north as a result of climate change. Conservation Biology 21(2): 534-9.
  • Langham et al 2015. Conservation status of North American birds in the face of future climate change. PLoS ONE 10(9): e0135350.
  • La Sorte, F.A., and F.R. Thompson III. 2007. Poleward shifts in winter ranges of North American birds. Ecology 88(7):1803–1812.
  • La Sorte FA and Jetz W. 2012.  Tracking of climatic niche boundaries under recent climate change.  J Anim Ecol. 81(4): 914-25.
  • Prince, K. and B. Zuckerberg. 2015. Climate change in our backyards: the reshuffling of North America’s winter bird communities. Global Change Biology 21(2): 572-585.
  • Stephens et al 2016. Consistent response of bird populations to climate change on two continents. Science 352(6281): 84-7.
  • Virkkala, R. and A. Lehikoinen 2014. Patterns of climate-induced density shifts of species: poleward shifts faster in northern boreal birds than in southern birds. Global Change Biology 20: 2995–3003.

[A more complete list of academic papers about birds and climate change, with highlighted abstracts, is available in the Documents section of the Birds and Climate Change Facebook group.]

Like many birds with expanding ranges, Limpkins have been slowly recovering for decades from historic habitat impacts. There are historic records (from the 1800s) from Georgia, which they did not occupy again meaningfully until 1994. Likewise, expansion into the Florida panhandle was not until the late 1980s. This fits the typical climate change pattern, with ecosystem changes beginning in the mid to late 1980s. Range expansions, however, can be variable, with different species crossing ecological and climatological thresholds at different times.

eBird status map for Limpkin
The current eBird status map for Limpkins shows them as regular from Houston to North Carolina.

Like most of the species shifting their ranges, Limpkins are generally non-migratory, though may have some seasonal movements based on water levels and foraging conditions. Most the recent northern records have been in summer. It is not known if these birds return south in fall, or die, not being able to withstand the winter. That said, they are undoubtedly establishing year-round presence in southern Louisiana (where the first state record was in 2018), and likely from Texas to South Carolina. There are recent winter records from Iowa, Ohio, Oklahoma, Kentucky, and Virginia.

Limpkin southward expansion in Argentina and Chile
The Limpkin may be one of the few species expanding poleward in both directions.

The Limpkin also ranges south into Central and South America. Its scientific name is Aramus guaranauna, the latter part being the Tupí name for it. Until 2018, it did not occur south of Bahia Blanca, Argentina (at least not in eBird). Its core range ended closer to Buenos Aires. However, with a record in 2018 and four more in 2020 (based on eBird, which is used less in South America), it has spread up to 700 miles south, mimicking its poleward spread in North America. Northern Ohio is also about 700 miles from the Limpkin’s core range in Florida. The southernmost record, found dead at Puerto Deseado, Argentina, is at 47.8 degrees south latitude. The northernmost record, just north of Minneapolis, is at 45.2 north latitude. Like a true invasive species, one even crossed the Andes!

Limpkins are not the only waterbird associated with Southeast wetlands that are expanding north. Birders have noticed northward range expansions among the following:

  • White Ibis
  • Neotropic Cormorant
  • Black-bellied Whistling Duck
  • Purple Gallinule
  • Anhinga
  • Roseate Spoonbill
  • and even Snail Kite, Swallow-tailed Kite, and Mississippi Kite
Limpkin

Many of these are actually declining in Florida (or Louisiana) as they increase in the north.

Indigenous Americans relied on observations of nature to provide information about weather, or when certain plants could be planted or harvested, or when certain fish or game were available. An Anhinga in New York, a Purple Gallinule in Ohio, White Ibises nesting in New Jersey, all of which have happened in this year – would be portents of change – or doom.

Miners kept canaries in coal mines to monitor the atmosphere. A sick or dead canary meant dangerous conditions in the mine. But imagine their surprise if their mine was suddenly invaded by a hundred canaries. That would mean something was amiss outside. Limpkins are becoming those canaries.

BREAKING: One day after posting this, a first record for Ontario, Canada.

UPDATE IN JULY 2023: Limpkin has reached Pennsylvania.

Is Homo sapiens a boom-bust species?

abandoned school
Projections suggest the human population will fall 50% by the year 2300.

The boom: Life in the fast lane

The basic facts are clear. Homo sapiens cruised along for most of our 200,000 years with a small population, probably less than a hundred thousand. Then something happened. We expanded, emigrating out of Africa and across the globe. About 10,000 years ago, when our population was around four million, we developed agriculture. Cities and large organized societies – and money and writing – came along later. The human population really took off. This growth became exponential. Homo sapiens passed 1 billion around 1800, 2 billion in 1928, and 5 billion in 1987. Our impact on the earth has been so dramatic that geologists have coined a new geological epoch: the Anthropocene. When I was a child, I was told there were more humans alive on the earth than had ever existed in the history of the species. If that’s not the definition of a population boom, I don’t know what is.

graph of world population over last 12,000 years

Today we’re just over 8 billion, but we’ve passed an inflection point. The rate of increase is decreasing, from 2% per year in the 1960s to less than 1% now. The S-curve is forming. The top of the curve is bending, ultimately to be replaced by a decline. Demographers predict that human population will peak in 2064 at about 9.7 billion. After that, the decrease may be equally precipitous.  

In most “developed” nations, the fertility rate (the average number of children that a woman has in her lifetime) has fallen below 1.6. The fertility rate is 1.23 in Spain, 1.24 in Italy, 1.34 in Japan, 1.44 in Austria, 1.53 in Germany, 1.56 in the UK, and 1.64 in the United States. It takes a fertility rate of at least 2.0 to maintain a steady population (not counting immigration). The countries with the highest fertility rates, over 4.0, are in sub-Saharan Africa and Afghanistan, though even those are declining sharply. Every nation in the world may have a shrinking population by 2100.

fertility rates across the world
Without immigration, high-income nations with low fertility rates will see much more rapid population declines. Regardless, all nations may have shrinking populations by 2100. Source.

The bust: It’s the end of the world as we know it

The worldwide average fertility rate is predicted to be 1.7 by 2100. That implies a population decline of about 9% each generation (about 25 years). This, in turn, implies a 50% decline in total population within 200 years, and a 90% decline, back below one billion, in 600 years. That’s basic math. That’s a freefall, a massive shrinking of human society.

graph of world population into the future based on a fertility rate of 1.7
The implications of a worldwide average fertility rate of 1.7.

This kind of population collapse is not unheard of in the natural world. Many species, from lemmings to locusts to crabs to passenger pigeons, are known as boom-bust species, with wild swings in their populations. Some research suggests that wild swings in animal populations may be the norm.

The bust – the fall, the decline, the collapse – is often driven by hitting the carrying capacity of the resources they depend on. Simply put, the species runs out of habitat or runs out of food. Life, literally, becomes too difficult. Animals may die or simply fail to reproduce.

When the world is running down, you make the best of what’s still around

What is it like to be an individual living during a bust cycle? Apart from a few perturbations in history (see Collapse by Jared Diamond), it’s a world that humans are unaccustomed to.

The economy will be shrinking, both supply and demand. The stock market will fall daily, for most businesses will be in decline. Stores will be closing, never to re-open.

Projected future workforce by nation
The number of working age adults (assuming some migration between nations).

By definition, deaths will outnumber births, which means the demographic age mix will be decidedly older. By definition, many won’t have children to look after them. They will need to rely on paid caregivers, which will be in short supply.

We have a hint of that economic upheaval now, with supply shortages as we emerge from the Covid pandemic. Recent research suggests that half the lost workers in the US today are actually a result of Trump’s crackdowns on legal immigration. It is immigrants, after all, who make up the difference in the US’s low fertility rate. Those labor shortages, and the resulting supply chain problems and inflation, are caused by more people aging out of the labor force than aging in. This can only be mitigated by immigration.

When immigrants are no longer available, how does a nation manage a declining economy, a permanent recession? Public services – police, fire, water, electricity – will be difficult to provide everywhere. Service will be terminated in rural areas. Outlying areas and small towns will be abandoned as people seek services (primarily medical at first) in larger cities. Schools, healthcare clinics, stores, and homes will crumble as the population concentrates into remaining urban centers. All production, especially agriculture, will need to efficient, relying less and less on labor. With a lack of private investment, will government need to play a stronger role to guarantee the provision of goods and services?

What does this mean for culture? So many of the values, customs, and social rules of the past ordered growing societies, supporting the family, state, and nation. In a declining society, the center, the things we hold dear, does not hold. Things fall apart. Sure, one can strive for personal peace and meaning, but family lines will end. There are no “greatest” generations building infrastructure for the future.

Will there be a collective future to aspire to? Perhaps divisions of the past – gender, race, nationality – will lose meaning in the face of a shared human condition. On the other hand, we already see those tensions exacerbated as people glimpse the future, desperate to cling to the past.

Perhaps a shrinking economy can be managed. Perhaps there is a soft landing to societal collapse, to shrinking our footprint to a new steady-state in a sustainable harmony with nature.

We don’t know yet. We’re still on the crest of the wave, the top of the curve, enjoying the best of times. It’s our kids and grandkids and great grandkids who will come up against that carrying capacity. And that’s exactly why many are choosing not to have kids. Others don’t have kids because they have other economic or personal opportunities, thanks to our societal successes. But even in this decision, they feel no imperative to have kids. Indeed, the imperative is to reduce our impact on the earth. It looks as if that will happen. For the earth, a short-lived Anthropocene will no doubt be a good thing. For the people living during the collapse, perhaps not.

dystopian art of a city
How do economies and societies function when it gets to the point that they are obviously shrinking?

eBird Trends maps reveal dramatic northward range shifts in Eastern species

Over a year ago, on a webinar hosted by the Washington Ornithological Society (WOS), John Fitzpatrick of Cornell Lab of Ornithology teased us with some screenshots of eBird Trends maps. I was mesmerized. Now, they have been released here at the eBird Science tab. These remarkable maps illustrate population trends for each species across their range, showing exactly where they are increasing (blue dots) or decreasing (red dots).

They do more than that, actually. The color of the dot is correlated to the rate of change — the % change between 2007 and 2021. Dark blue means really increasing; dark red really declining. The size of each dot is correlated to the size of the population in that area (or “relative abundance” in eBird lingo). Big dots mean there’s a lot of birds there, regardless of whether they are increasing or decreasing. If you hover over a dot, the actual numbers pop up. White dots mean the data are inconclusive or show no trend. You can read more of the details at the site, and perhaps I’ll discuss methodology on a later post.

Here’s the amazing thing — each dot represents a 27 x 27 km (16.7 x 16.7 mile) grid square, so just a bit larger than a Christmas Bird Count circle, which are 15 miles in diameter. That’s a remarkable level of detail. I joke that there’s more information in these maps than in all the ornithological research in the last ten years. That’s an overstatement, of course, because professional ornithologists study things that eBirders don’t. Nevertheless, these maps take crowdsourced data collection and present it in ways that are instantly useful for understanding species population trends at a granular level. This has profound implications for targeting conservation.

So, on to my first of probably many posts looking at these maps. My first peruse suggests they strongly support what the climate change research has been saying — that resident and short-distance migrants are shifting their ranges north. Let’s start with some common eastern species.

CLICK TO ENLARGE

To examine each map in detail, go to eBird’s Trends page, type in the species name, and then click “Trends” to the right of the species’ name.

Until now, most of the published literature on northward range shifts have been meta-analyses with conclusions such as “non-migratory species are shifting north by so many km per year”, but no maps, nor even mention of species by name. Here, we get the details in bright colors, at the species and even county level. Wow.

A few observations. For many species, they are declining where they are still common (the red dots are large), and increasing where they are less common or even rare (the blue dots are small). This probably implies that their overall population is declining. It also suggests that climate change may be hurting them in the south faster than it is helping them in the north. It takes time to establish new populations, and/or the new regions may not be as suitable as their old home. Note also that each of these species have different transition isoclines (if that’s what one would call it). For example, Red-bellied Woodpecker and Carolina Wren are increasing in Tennessee, but Tufted Titmouse are declining there.

Here are some relevant papers regarding range shifts in eastern species, but again, these maps communicate their results in new and vibrant ways:

Prince, K. and B. Zuckerberg. 2016. Climate change in our backyards: the reshuffling of North America’s winter bird communities. Global Change Biology 21(2): 572-585. We conclude that a shifting winter climate has provided an opportunity for smaller, southerly distributed species to colonize new regions and promote the formation of unique winter bird assemblages throughout eastern North America.

Rushing, C.S. et al. 2020. Migratory behavior and winter geography drive differential range shifts of eastern birds in response to recent climate change. Proceedings of the National Academy of Sciences117(23), pp.12897-12903. Since the early 1970s, species that remain in North America throughout the year, including both resident and migratory species, appear to have responded to climate change through both colonization of suitable area at the northern leading edge of their breeding distributions and adaption in place at the southern trailing edges.

Saunders et al. 2022. Unraveling a century of global change impacts on winter bird distributions in the eastern United States. Global Change Biology We conclude that climate has generally governed the winter occurrence of avifauna in space and time, while [habitat] change has played a pivotal role in driving distributional dynamics of species with limited and declining habitat availability.

The maps also support some of my previous blog posts: such as the northward expansion of Northern Cardinal, Carolina Wren, Tufted Titmouse, and Red-bellied Woodpecker, the crash of Florida’s white-eyed Eastern Towhees, certain range expansions of the Lesser Goldfinch and California Scrub-Jay, the expansion of many species from California into the Pacific Northwest, and the failure of oak-dependent species (e.g. Oak Titmouse and Nuttall’s Woodpecker) to go anywhere.

In future posts, I’ll look at range shifts in resident birds of the West, the impact of California’s fires (many encompassing several of these Trends dots), long-distance migrants, nationwide species, waterbirds, and seabirds, among other things.

Setting the record straight on the California Bee-eater of 1786

On August 1, 1785, a French expedition led by Jean François de Galaup, comte de Lapérouse (referred to as Lapérouse) set off with a goal to explore the world, both politically and scientifically. Specifically, they were to explore trading possibilities and the activities of foreign powers, both European and indigenous, map the world, and do science. On board their two vessels, L’Astrolabe and La Boussole, were experts in astronomy, geology, agriculture, botany, birds, medicine, and two illustrators.

The illustration of a “California Bee-eater”

They visited, in this order, South America, Easter Island, Hawaii, Alaska, California, various locations in East Asia, the South Pacific, and Australia. They departed Australia on March 10, 1788, bound for New Caledonia and the Solomon Islands and were never heard from again. The search for their vessels — and them — has been the subject of eight French investigations. Information gathered from 1826 to 2005 concluded that the vessels wrecked on the Solomon Island of Vanikoro and the survivors were killed by the local inhabitants.

Fortunately, at various ports of call, they shipped home reports, maps, and illustrations from their travels. While incomplete, these were eventually published as Voyage de La Pérouse autour du monde (“The voyage of La Pérouse around the world”). See also this version of the voyage.

The whole of their visit to California was a brief stay at the Spanish mission at Monterey from September 14 thru 22, 1786. As they were the first foreigners to visit the missions since they were founded in 1769, they provided a unique firsthand account. For the most part, they were appalled by the conditions of the Native “converts” and compared the mission to a slave plantation. It was because of this that I was reading Life in a California Mission, an excerpt from The Journals of Jean François de La Pérouse (Heyday Books, 1989).

This ludicrously colorized version is sold online as the “first known illustration of a California bee-eater”

There are three bird illustrations: one is a pair of California Quail, another is likely a Varied Thrush from Alaska, and the third is this one, identified as a “promerops” or bee-eater. Later publications attempt to identify it correctly, usually as a thrasher (both California and brown!). To me, it is clearly a Yellow-billed Cuckoo. The unique undertail pattern, the bill shape, and the head pattern all match well, and really match no other species. The way it is perched upright in a tree is better for cuckoo than thrasher. I can find no publication that identifies it as a cuckoo. (Nor can I find one that identifies the “Black Bird” below either.)

While eBird only shows a single record for Monterey County in September (Sept 21, 1998; Andrew Molera State Park; Don Roberson), there are a handful of other records for northern California in September. Of course, the species, virtually extirpated from the region now, would have been far more common then, presumably nesting in riparian corridors from the Carmel River to the Salinas Valley, all within the travels of the French expedition.

Here are the other two illustrations of birds.

This “Black Bird” is from Porte des Français, or Lituya Bay, Alaska, near Glacier Bay National Park. It appears to be a Varied Thrush (note Blackbird in Europe is a thrush). Thanks to Jeremy Gatten for the help on this one!

The route of the Lapérouse expedition in 1786.

Heading south for winter, more birds are choosing the Pacific Northwest

Many papers predict that bird ranges will shift northward with a warming climate (Wu et al 2018, Langham et al 2015).

Many studies have already documented that this is happening (Illán et al. 2014, Virkkala, R. and A. Lehikoinen 2014, Hitch and Leberg 2007, and La Sorte and Thompson 2007).

And some have documented poleward range shifts specifically for wintering ranges (Saunders et al 2022, Hampton 2019, Paprocki et al 2017, Prince and  Zuckerberg 2016, and Paprocki et al 2014).

I’ve previously written about an increase in insectivore bird species in winter associated with a warming climate in the Sacramento Valley. As the Putah Creek Christmas Bird Count (CBC) compiler, it was hard not to notice the trends. Cassin’s Vireo, Black-throated Gray and Townsend’s Warblers, and Western Tanagers were becoming more expected in winter. We had crossed a threshold; we didn’t get freezes anymore. My bougainvillea and cape honeysuckle, which previously clung to life in winter, were now growing and blooming year-round. Fruit and insects were available to these birds.

Now in Port Townsend, Washington, we set a local CBC record for Yellow-rumped Warblers last year. This caused me to take a closer look at the data, focusing on Passerines that are rare or uncommon, and at the northern edge of their wintering range. They are: Hermit Thrush, Cedar Waxwing, Lincoln’s Sparrow, White-crowned Sparrow, Orange-crowned Warbler, and Yellow-rumped Warbler. For each of these, the PNW is at the northern limits of their wintering range.

I looked at their numbers and trends on the Portland, Olympia, Seattle, Bellingham, and Vancouver BC CBCs since the 76th CBC (winter 1975-76). I’ve got more notes on my methodology at the end.

Results

All have increased since 1975, generally with the uptick beginning in the 1990s. Here are the results of my inquiry.

The range maps are from eBird’s Abundance Maps. Red=summer; blue=winter; purple=year-round; yellow=migration. The graphs show the birds per party hour across the five CBCs, taking the total number of birds and dividing by the total number of hours across all five counts.

Hermit Thrush

Hermit Thrush has been increasing at a rate of 4.2% per year across all the CBCs. It has been increasing across all five of the counts, most strongly in Vancouver (4.1% annual growth) and most tepid in Seattle (0.6%). It is most common on the Portland count, which has averaged 26 Hermit Thrushes per count since 2009.

Cedar Waxwing

Of the six species I focused on, Cedar Waxwing showed some of the most erratic growth, averaging only 2.5% per year. That said, it has been above average 8 of the last 9 years. To illustrate the unpredictable nature of waxwings, they have actually been declining on the Olympia (-2.3%/yr) and Vancouver (-4.1%/yr) counts. They are increasing the most on the Portland count (3.0%/yr).

Lincoln’s Sparrow

Lincoln’s Sparrow has been increasing steadily, from near zero, at an overall rate of 3.6% per year. To put this in perspective, these five CBCs tallied 5 or fewer individuals, summed across all counts, in each of the first five years of this analysis. In each of the last five years, these counts, in aggregate, tallied between 34 and 52 individuals. Growth has been strongest on the Olympia count (4.6%/yr) and weakest on the Bellingham count (1.7%/yr).

White-crowned Sparrow

Despite the eBird map, White-crowned Sparrow is a regular overwintering species in the PNW. The five counts, in aggregate, tally between 100 and 750 individuals each year. They’ve been increasing at a rate of 1.8% per year, strongest in Seattle (3.1%/yr) and weakest in Vancouver (-2.5%/yr, the only count with declining numbers).

Orange-crowned Warbler

Orange-crowned Warbler has seen dramatic increases, averaging 5.0% per year, highest in Olympia (7.2%/yr) and lowest in Bellingham (3.2%/yr). The numbers, however, are still small. Aggregate numbers across all counts were zero five of the first eleven years of this analysis (easily seen on the graph). Double digits were not reached until 1999. The last ten years, however, have averaged 15 individuals across all the counts, making this an expected species in winter now.  

Yellow-rumped Warbler

Yellow-rumped Warbler wins the award for poster child of species increasing in winter at the northern edge of their wintering range. They’ve been increasing at a rate of 5.3% per year. Interestingly, this growth is concentrated in the south. Portland (3.7%/yr), Olympia (3.4%/yr), and Seattle (6.1%/yr) have seen the most growth, while Bellingham (-0.5%) and Vancouver (-5.0%) have seen declines. Perhaps those Fraser River winds are too cold for warblers. 

Methodology

The data includes bird per party hour for the Portland, Olympia, Seattle, Bellingham, and Vancouver BC Christmas Bird Counts from the 75th count (winter 1975-76) to the 120th count (winter 2019-20). The 121st count was impacted by the pandemic.

CBC (and Breeding Bird Survey) data is uniquely advantageous for looking at long-term trends such as climate change, as they both go back many decades with generally similar effort over time (for certain well-established counts). Nevertheless, there were some issues with this data:

  • I did not use the Portland data from the 76th thru the 82nd count, due to aberrantly low party hours relative to later counts.
  • The following data was missing entirely from the Audubon CBC database: Olympia 76th, 77th, 78th, 84th, 104th, and 110th counts; and Seattle 91st count.
  • The following counts had no (or obviously incorrect) data for party hours: Portland 104th count; Bellingham 111th, 112th, and 119th counts. Because they did have bird numbers, I approximated the party hours based on their counts in nearby years. I used 230 party hours for the Portland count and 200 party hours for the Bellingham counts.

Other climate-related bird changes in the Pacific Northwest

I’ve previously blogged about climate change and birds in the Pacific Northwest:

The invasion of the Pacific Northwest: California’s birds expand north with warmer winters looks at northward range expansions of Great Egret, Turkey Vulture, Red-shouldered Hawk, Anna’s Hummingbird, Black Phoebe, Townsend’s Warbler, and California Scrub-Jay, with some discussion of others as well. Note that Townsend’s Warbler, as a migrant that winters rarely in the PNW, fits with the group of birds described in this post.

The song of the Lesser Goldfinch: Another harbinger of a warming climate looks at increasing records in the PNW in summer.

Mapping the expansion of the California Scrub-Jay into the Pacific Northwest looks at the steady range expansion of this non-migratory species.

References

Hampton, S. 2019. Avian responses to rapid climate change: Examples from the Putah Creek Christmas Bird Count. Central Valley Birds 22(4): 77-89.

Hitch and Leberg. 2007. Breeding distributions of North American bird species moving north as a result of climate change. Conservation Biology 21(2): 534-9.

Illán et al. 2014. Precipitation and winter temperature predict long-term range-scale abundance changes in Western North American birds. Global Change Biology, 20 (11), 3351–3364.

Langham et al 2015. Conservation status of North American birds in the face of future climate change. PLoS ONE 10(9): e0135350.

La Sorte, F.A., and F.R. Thompson III. 2007. Poleward shifts in winter ranges of North American birds. Ecology 88(7):1803–1812.

Paprocki et al. 2014. Regional Distribution Shifts Help Explain Local Changes in Wintering Raptor Abundance: Implications for Interpreting Population Trends. PLoS ONE 9(1): e86814.

Paprocki et al. 2017. Combining migration and wintering counts to enhance understanding of population change in a generalist raptor species, the North American Red-tailed Hawk. The Condor, 119 (1): 98–107.

Prince, K. and B. Zuckerberg. 2016. Climate change in our backyards: the reshuffling of North America’s winter bird communities. Global Change Biology 21(2): 572-585.

Saunders et al. 2022. Unraveling a century of global change impacts on winter bird distributions in the eastern United States. Global Change Biology

Virkkala, R. and A. Lehikoinen 2014. Patterns of climate-induced density shifts of species: poleward shifts faster in northern boreal birds than in southern birds. Global Change Biology 20: 2995–3003.

Wu et al. 2018. Projected avifaunal responses to climate change across the U.S. National Park System. PLOS ONE 13(3): e0190557.

I try to maintain an updated list of references at the Birds and Climate Change Facebook group. At that page, click on Files to find the list.

A Nazca Booby, a tug, a barge, and a pit: A climate parable

At 9:30am on August 17, that is, yesterday, I got a text from another birder. A Nazca Booby had just been seen from Discovery Point near Seattle. What’s more, we knew exactly where the bird was now; it was perched on the bow of a barge being pulled by the tug Seaspan Raider.

The Nazca Booby, atop the barge, photographed by Matt Stolmeier, captain for Outer Island Excursions.

The Nazca Booby is a tropical seabird that breeds exclusively on the Galapagos Islands. When not nesting, it occurs at sea in the eastern Pacific, generally between central Mexico and northern Peru.

Breeding (orange) and non-breeding (blue) range of the Nazca Booby.

This was Washington’s third record. The first, quite possibly the same bird, was on August 14, 2020, in pretty much the same part of Puget Sound. The second was a few weeks ago also off Seattle. That one was an immature, not an adult, so we know it was a different individual. It then showed up off Victoria, providing Canada with its third record.

The Nazca Booby first arrived in the United States in California in 2013. I actually played a role in that first record, a dead beachcast bird found in the aftermath of an oil spill. Working for the state’s spill response, I brought it to the attention of the California Bird Records Committee and had experts examine the carcass for identification. That bird was not a one-off event; it was the beginning of an invasion. There were a few scattered records in the following years, followed by an explosion of 26 records in 2018 and 21 in 2019. After that, California removed the species from its “review list”. While some of these records may have been the same individuals, it is remarkable that a tropical bird previously unheard-of in the US was suddenly widespread. Oregon got its first two records in 2018 and 2019.

Sea surface temperature (SST) of 66.1F off the Washington/Oregon coast.

Checking sea surface temperatures, I see that the water off the Washington and Oregon coasts is reaching 66F in places, only 4F cooler than on the south side of the Galapagos. Zooming out, it is easy to see a route from there to here where the bird never had to encounter sea surface temps under 60F. The Strait of Juan de Fuca is in the low 50s, but it does approach 60F near Seattle.

I opened the MarineTraffic app and quickly located the Seaspan Raider. It was southwest of Edmunds, northbound at 7.3 knots. I calculated it would arrive off Port Townsend between 1 and 2pm. Birders scrambled, heading to various coastal promontories on both sides of Puget Sound. I headed to Point Wilson, where Puget Sound effectively ends and meets the Strait of Juan de Fuca. The tug, bound for Canada, would have to pass by me here.

Reports came in. The bird had flown off the barge. It was in the water off Edmunds. It took off. It was seen from both sides. No one knew where it was.

Tracking the tug using the MarineTraffic app.

This wasn’t the only booby in the Salish Sea at the moment. A Brown Booby had been photographed a few days earlier near the San Juans. That was yet another tropical seabird that had already invaded the US, with records from over forty states, including Alaska. Two decades ago, this would have been unimaginable. And this summer, 2022, was already noteworthy across the Midwest and East Coast for the mass invasion of waterbirds typically found only in Florida or the Gulf Coast. Limpkins, Wood Storks, White Ibis, Roseate Spoonbills and many others were showing up hundreds of miles north of their previously known ranges.

Scrolling thru the American Birding Association Rare Bird Alert nationwide posts, limited to just mega-rarities, here is what pops up: Brown Booby in Oklahoma, Neotropic Cormorant in North Carolina, Brown Booby in Wisconsin, two Swallow-tailed Kites in Ohio, Limpkin in Wisconsin, Neotropic Cormorant in Michigan, White Ibis in New York, Wood Stork in Pennsylvania, Heermann’s Gull in Alaska, Limpkin in Illinois, Nazca Booby in California, White Ibis in Nebraska, etc. And that doesn’t even get us back to August 1. These are all birds, mostly aquatic birds, well north of their normal ranges.

Our current rate of climate warming hasn’t been seen since the Paleocene-Eocene Thermal Maximum (PETM) 55 million years ago. Then, there were alligators within the Arctic Circle. Kind of like Nazca Boobies are now a thing in Puget Sound. Actually, our current rate of warming is much faster than then. During the PETM, the climate warmed 5C in five thousand years. The current rate of warming is eighteen times faster. Then, no one would have noticed. Now, there is 1C of warming – and, with it, dramatic changes in climate and ecology – within the lifespan of a single bird. Some seabirds are showing us that they can keep up, thanks to their ability to fly long distances. I’m not sure about the alligators. Or birds that depend, say, on oak trees. The birds can fly, but the oaks can’t.

Two hours passed. I was ready to give up and head home, my only consolation being “MAMU CF”, a Marbled Murrelet making a provisioning flight across the Sound, carrying a fish to its single chick somewhere on a moss-covered Doug fir branch a hundred feet above the forest floor, probably in the Olympic Mountains. I’d only seen that once before. Much of their range in California has been lost to fires in the past five years, so this Olympic chick is important.

The original photo of the Nazca Booby on the barge, by Alex Meilleur.

One birder, who was unable to search for the Nazca Booby, called some of the local orca boats, as he worked on some of them. He let them know about the bird, as some were near it. About twenty minutes later, texts came in. They had re-found it! It was back on the same barge, now approaching Marrowstone Point. I spun my scope south. There, beyond the ferry lane, I could make out the red and white structure of the Seaspan Raider, pulling its barge, all blurry and shimmering in the distant heat mirage, slowly chugging toward me.

Taking advantage of the outgoing tide, the Seaspan Raider was now hitting 9 knots. It is powered by two Niigata 6m G25HX diesel engines. I don’t know what kind of gas mileage it gets, but, because it presumably refueled in Washington, most of its fuel is likely conventional diesel, but a small component may be renewable diesel.

Renewable diesel is not the same as biodiesel. Biodiesel can be mixed with conventional diesel, but only in very small amounts, like 2%. Renewable diesel, on the other hand, is molecularly identical to conventional diesel. It’s a relatively new invention. Made from non-petroleum sources, such as plant and animal material, it is to conventional diesel what corn syrup is to sugar; it is a “drop-in ready” alternative fuel. It can be mixed with or substituted for conventional diesel seamlessly, with no change in gas pumps, pipelines, or engines. In fact, it burns slightly cleaner, so engines last longer. It emits fewer particulates and, most importantly, its greenhouse gas footprint is up to 80% less. Its use is already widespread in California, where two of the state’s largest refineries no longer take petroleum crude.

This is the kind of thing that should have been developed thirty years ago, just after James Hansen of NOAA briefed congress on climate change in 1986. Now it’s late. We’ve already had more than 1C of climate warming, with more coming and probably ten feet of sea level rise built into the system. Stopping carbon emissions is no longer a suitable goal. We’ve already pushed the cart down the ramp. It’s rolling. We need to reverse climate change, to change that ramp so the cart rolls back to where it was. That will require actually sucking CO2 out of the air – negative emissions – which will certainly take a hundred years under the most optimistic scenarios. So get ready for more boobies, maybe even Limpkins and alligators.

Aside about Washington: Washington further delayed action a few years ago when the Department of Ecology required an Environmental Impact Statement from Phillips 66 to convert their refinery at Cherry Point to make renewable diesel. That is to say, Phillips needed to jump through major permitting hurdles because they were changing – that is, reducing — their greenhouse gas emissions. Phillips didn’t want to wait the several years required for this, so they promptly moved their operation to California. Governor Inslee tried to intervene and save the project, but it was too late. Now BP is picking up the baton in Washington.

Renewable diesel is already in widespread use in trucks, especially in California. The ferries in San Francisco Bay are powered exclusively by it. Because diesel is similar to jet fuel, and made during the same refining process, refineries also produce what is called sustainable aviation fuel (SAF). Aircraft are currently permitted to fly with up to a 50/50 blend of SAF and conventional jet fuel. Boeing promises jets that can fly with 100% SAF by 2030. We’ll be approaching 1.5C of warming by then. Nazca Booby will almost certainly be off the rare bird review list, at least in California. Brown Boobies will be breeding on the Farallones and prospecting further north.

I watched as orca boats came and went from the barge, photographing the Nazca Booby. I was told it was on the starboard side of the roof of the little structure on the bow. The tug and barge continued up Admiralty Inlet until it was straight out from me, as close as it would pass. Slightly more than halfway across the channel, it remained blurred in heat mirage. I could see fuzzy white dots on the described rooftop, but I couldn’t tell you if they were Nazca Boobies or gulls or volleyballs. In birder’s lingo, this was going to be a ‘dip’, even though I knew exactly where the bird was and was looking at it.

My view of the tug, barge, and bird.

Mathematically, this would be at least the sixth time a Nazca Booby had passed this point, my point, my sea watch. And this time I was here, ready and waiting, and still I couldn’t see it. Were it not for the texts and the orca boats, I’d never know it was there. I kept my scope glued to it, hoping it would lift off in a distinctive flight and head directly toward me, where it would join the Caspian Terns and plunge dive right in front of me as I clicked my camera in ecstasy. But it didn’t. The tug and barge chugged north.

The bird was last seen at Partridge Point on Whidbey Island, still riding the barge. It was off the barge by Rosario Inlet. I’m guessing it jumped ship and headed toward Victoria or Smith Island.

The barge’s destination was the Lafarge Texada Quarrying Ltd. limestone mine north of Vancouver. Limestone is critical to making cement. The cement-making process is responsible for 8% of the world’s carbon emissions. Part of that is from the energy used in production, which requires a kiln heated to 1,400 degrees Celsius. But most of the emissions comes from the limestone itself. Forty percent of the weight of limestone is CO2, and this is burned off in the process. There are efforts to improve the cement-making process, to make it less dependent on limestone, to reduce its carbon emissions. That’s all coming in the future.

The limestone mine at Beale Cove, the barge’s destination.

I’m wondering about the ancient Nazca civilization in what is now Peru. It was dependent on a remarkable network of underground aqueducts that delivered mountain water to their arid home. There’s a theory that they over-harvested a certain tree, which led to erosion of riversides during heavy rains, destroying their water delivery system. I wonder if they had meetings about the problem, if they had new policies in effect, at least at the end, when it was too late.

It’s supposed to be 95F in the Seattle suburbs today. I’m not worried about missing this Nazca Booby. There will be more.

The Nazca Booby on the bow. I’m sure the scope views were better. Photo by Laura Brou.

Eastern Towhee: Can the white-eyed subspecies survive even 1.5C climate change?

Pale-eyed and red-eyed forms diverged approximately 18,000 years ago.
Photo by Melissa James/Macauley Library.
eBird abundance map for Eastern Towhee. It is resident in the southeast, but expands north in summer.

The Eastern Towhee, a bird of scrub and thickets, is a common resident in the southeast United States. One subspecies migrates north in summer.

They are a prime example of a species that is considered “Least Concern” by the International Union for Conservation of Nature (IUCN), but “High Risk” in National Audubon’s assessment of birds under climate change. In their 3.0 C scenario, they predict it would lose 83% of its current breeding range, while gaining only 23%.

This is National Audubon’s projection for the Eastern Towhee’s breeding range under just a 1.5C scenario. This would spell extinction for the white-eyed birds of Florida and the deep South.
Their winter range is not anticipated to change much.

These projections are consistent with recent literature showing poleward shifts of species ranges– of the northern edge of their range, of the southern edge, and of their range’s geographic center. The predictions for Eastern Towhee are among the most dramatic.

Recent research also suggests that non-migratory and short-distance migrants are more adaptable to climate change than are long-distance migrants, and more able to shift their ranges. Indeed, we are already seeing that with Eastern Towhee. The Audubon projections appear to be in progress.

Based on Breeding Bird Survey (BBS) data, the Eastern Towhee breeding population in Florida has declined over 50% since the late 1990s. The timing of this is consistent with worldwide ecological shifts which began in the mid-1980s.

The white-eyed subspecies appears to be already in trouble. eBirders in Florida in May and June are encountering the species half as often as they were just six years earlier.

eBird data from Florida, focusing on frequency of lists reporting the species during the May-June period, shows that the maximum frequency has fallen from 18.3% in 2015 to 8.6% in 2021.

Not all range shifts are due to climate. As a scrub specialist, the Eastern Towhee prefers habitat that is in the act of regrowth, such as after a fire or being cleared. But they don’t want a forest either. To quote the Birds of the World species account for Eastern Towhee: “As farmland is abandoned, successional changes produce suitable midseral habitats that towhees favor, and their numbers increase. But, successional time is against towhees, and their numbers decrease as seres age.” That may be the explanation for the Georgia data (orange dots), which show a decline in the late 60s and early 70s, possibly due to forest growth or land clearance for development, and then a leveling off.  

As the climate warms, many species are expanding north and/or declining in the southern part of their range. But these need not happen simultaneously. Opportunities for suitable habitat may open doors in the north, and doors may close in the south, at different times. There is evidence of Eastern Towhee expansion in Minnesota, but look at the vertical axis; it does not compare with the losses in Florida.

In Florida, the white-eyed subspecies faces extinction based on National Audubon’s 1.5C scenario. They appear to have declined dramatically in the past two decades.

Photo from National Audubon website that provides range change projections under 1.5C, 2.0C, and 3.0C scenarios.

For more on climate change impacts on birds, I invite you to join the Birds and Climate Change Facebook group.

Mountain Bird Network seeks eBirders heading into the hills

The east side of the Olympics is a staircase of thrushes. The low country is for American Robins. As you get into woodsy habitat, you’ll hear the spiral song of Swainson’s Thrushes. After that, among the tall old growth along the streams, the ethereal Varied Thrush. Finally, up near timberline, you’ll hear singing Hermit Thrushes. Freeman and colleagues are tracking how these ranges are shifting with the climate.

Two 5-minute point counts at each stop as you gain elevation. June 1 to July 15. Entered into eBird. Shared with the Mountain Bird Network.

That’s all Ben Freeman, a post-doc at University of British Columbia, is asking for. And it can be any mountain, any canyon, any road.

The details are here: Mountain Bird Network.

An example of the data and analysis.

And have a great time!